NDIS Q4 Quarterly Report Deep Dive
The Hon Linda Reynolds CSC released the NDIS Quarterly Report for disability ministers Q4 2020-2021 on the morning of Monday 9 August, a pleasant and welcome change from late Friday night or a Saturday morning as has been the case of recent releases. DIA undertaken a NDIS Q4 Quarterly Report Deep Dive.
The report is a summary of how the Scheme performed from 31 March 2021 to 30 June 2021 with additional reporting on the full 2020-2021 year.
Key Scheme Numbers Include:
- 466,619 people with a disability are being supported by the NDIS
- 18,400 people with a disability joined the scheme in Q4
- 35% of new participants in Q4 were aged 0-6
- Participation costs in Q4 was $6.6bln
The value intermediaries bring to both participants and the NDIS is clearly demonstrated by the numbers of participants engaging Registered Plan Management and Support Coordination Providers across Australia.
On the data published by the NDIA, DIA’s CEO, Mr Jess Harper said:
“We welcome the release of the NDIS Q4 – Quarterly Report, the data in the report shows a continuing trend in participants requesting all or part of their funds to be managed by a Registered Plan Management Provider. The ongoing increase in the number of participants being funded with Support Coordination within their plan is also encouraging although a measure of adequacy of this would be a welcome addition to the data”.
OVERVIEW
This quarterly report comes in at an eye watering 630 pages and when you add the two Addenda into the equation you are looking at a staggering 722 pages of NDIA information. Given the recent debates around the future of the Scheme, and the calls for greater transparency of the assumptions driving the NDIA’s modelling, DIA was anticipating (maybe more hoping) that the quarterly report would provide greater insight into the NDIA’s forward thinking. This NDIS Q4 Quarterly Report Deep Dive notes unfortunately, yet again, DIA and no doubt the broader disability community have been left disappointed as what we have been delivered is simply more of the same.
Two Addendums Are Just Cutting The Same Old Data
During the Joint Senate Committee Hearing on 5 August, Senator Jordan Steele-John questioned the Minister on the forthcoming quarterly report and the data that it would contain:
Senator STEELE-JOHN: It’s also the challenge of using averages, Minister, as we’ve spoken about before. When you’re using average spends and average outlays, significant plans mask other trends in your data. That’s why we’ve been asking for more than just the average.
Senator Reynolds: Senator Steele-John, you are about to get about 700 pages of data that you’ve asked for. That will be with you on Monday.
In what appears to be a response to calls for greater transparency, the NDIA have included two addendums to the Q4 Quarterly Reporting documentation covering the declining level of functionality Q4 Addendum 1 – Analysis of Functional Decline and the increasing level of average participant payments Q4 Addendum 2 – Average Payment Per Participant.
DIA’s NDIS Q4 Quarterly Report Deep Dive below will save you precious time if you are looking for any analysis of why functionality of participants is declining whilst payments and, supposedly satisfaction, are increasing; don’t bother, there isn’t any! If you are interested in looking at how many ways the NDIA Actuary can cut up the same data, then the addendums will be fantastic reading! Unfortunately for both Senator Steele-John and the broader disability community, the NDIA have presented all of the payment data as averages so we don’t learn much that we can use going forward. So, if you are interested in any form of why and how this is driving the NDIA’s future modelling, then we would suggest you give them a miss.
DIA is disappointed that the NDIA have once again missed an opportunity to provide the much needed transparency in the data they report. We don’t need the pie cut up into smaller and smaller bits, we need the recipe.
As DIA highlighted in our analysis of the December 2020 AFSR Update DIA Analysis | December 2020 AFSR, the NDIA have not provided any detail regarding their assumptions for future:
- Participant entry;
- Inflation within the Scheme; and
- Participant spending.
Functionality Down but Social Participation and Activity Up – Again
Senator Steele-John also pointed out the concern that he, and the disability community, have with the NDIA’s reporting of functionality:
Senator STEELE-JOHN: In your opening statement, Minister, you once again observed the question of functional decline, as is being reported by the agency. Our committee has analysed some of the initial data that was given to us by the agency in relation to the processes and the information in relation to the processes by which the agency gathered that information. I can’t speak on behalf of the committee, but I have some quite serious concerns about the methodology used to generate those trajectories…….I would have expected—and I think many members of the community would have expected—this type of information to have been presented to us as part of at least a collaboration with a university or an expert body of one type or another. That’s really what people would be expecting.
The NDIA are still reporting declining functionality with increased satisfaction and outcomes (in this quarter we highlight the increase in reported Social and Community participation, however there are several measures the NDIA report that indicate increased participant outcomes that could be included here):
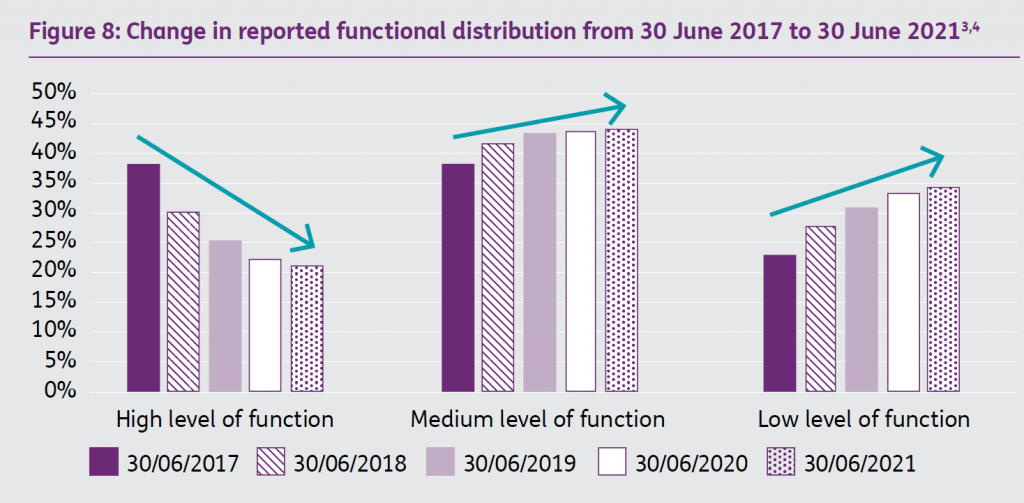
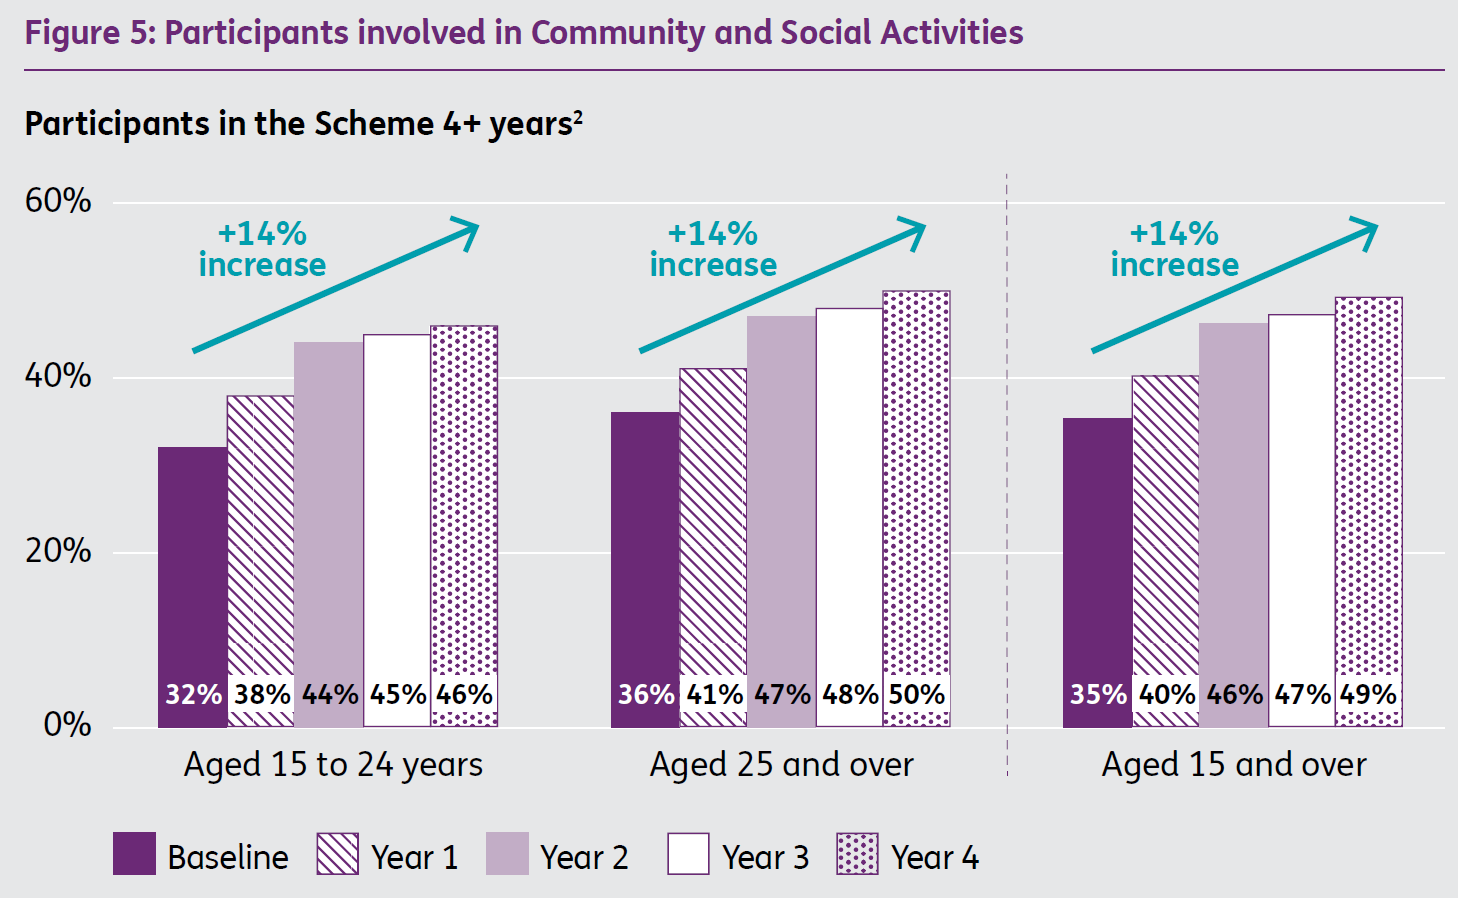
Unfortunately, the NDIA have again reported on what would appear to be a gross failing of the Scheme, a decrease in participant functionality, whilst highlighting the positive outcomes and satisfaction that participants are experiencing which is a clear contradiction! As we highlighted above, the addendum is just more of the same: the same data which was collected in the same way and reported in the same format. Once again DIA call on the NDIA to fully disclose the nature of this data so a full analysis can be undertaken to understand the true nature and reasoning of participant functionality.
Will the NDIA finally work with the disability community?
According to the first page of the Q4 report, the NDIA is committed to improved engagement with people with lived disability experience to develop a new person-centered model for assessments and will engage broadly with the disability community to better understand the financial sustainability of the Scheme. Exactly how this will be done is not yet clear.
The NDIA have also reinforced their commitment to delivering the Participant Service Guarantee (PSG) via the Participant Service Improvement Plan (SIP) but as we highlight snapshot below, the timing of these commitments seem to be subject to ongoing delays.
Whilst the words hit all the right notes (“co-design”, “collaboration”, “consultation” etc) the real measure will be in the actions of the NDIA when it comes to changes in legislation and implementing practical reforms that directly impact participants.
Choice and Control is an Issue
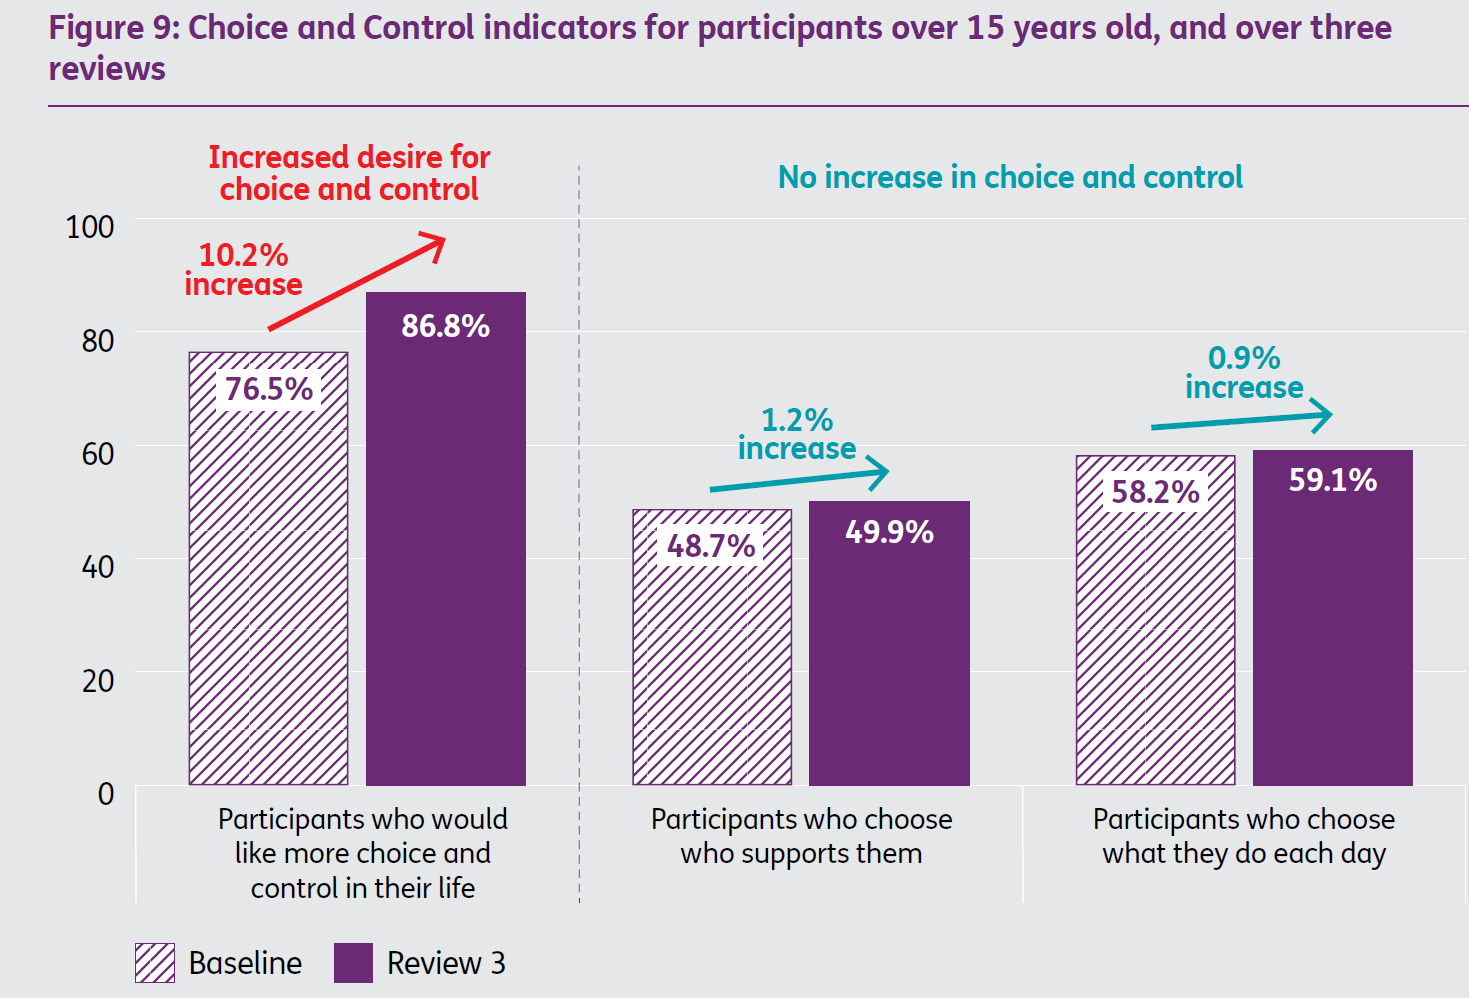
DIA couldn’t agree more that participants should have greater choice and control in the way their funding is spent by them to achiever their goals. What got our heads shaking was the accompanying commentary of the above graph:
“This inconsistency between a participants’ dream for greater choice and control, and their inability to obtain it is imbedded in the design of the Scheme, and should be addressed”.
In part the statement is correct in that the planning process does restrict choice and control, however DIA can point to numerous decisions that the NDIA have made in the past 12 months that have directly reduced the choice and control of participants that has nothing to do with planning! One that immediately comes to mind was the decision to remove the flexibility to use Core Funding for Support Coordination: Flexibility to use Core Funding for Support Coordination removed . The comment underlines one of the key issues inside the NDIA currently that the rhetoric, data and practical applications are not at all aligned. A dangerous scenario for such an important piece of Australian social infrastructure.
The SIP is Slipping….
Following the Tune Review, the NDIA implemented the Participant Service Guarantee (PSG) and the Participant Service Improvement Plan (SIP). The NDIA have been reporting on the progress of the SIP and over the past 12 months there have been a number of extended time frames noticed by DIA:
SIP – Face-to-face meeting with the person making decisions on plans and funding. June 2021 to December 2021 (6 months behind).
SIP – Manage your plan via a new NDIA mobile app. June 2021 to December 2021 (6 Months Behind).
SIP – Check in with participants on how their plans are going and if review needed. June 2021 to December 2021(6 Months Behind).
SIP – Promote children and young people’s voice in their own plans. June 2021 to December 2022 (18 Months Behind).
SIP – Apply to the NDIS in your way including an online access form. December 2021 to December 2022 (12 Months Behind).
SIP – Support more video-conference plan meetings. June 2021 to December 2021 (6 Months Behind).
SIP – Clearer about Support Coordination services and what to expect from them. June 2021 to September 2021 (3 Months Behind, DIA also note that it has been 12 months (yep an entire year) with no summary or outcome released by the NDIA on the Support Coordination Discussion Paper).
DIA will continue to monitor the progress of the deliverables of the SIP with many due for completion between December 2021 and June 2022.
Data Integrity – Plan Management
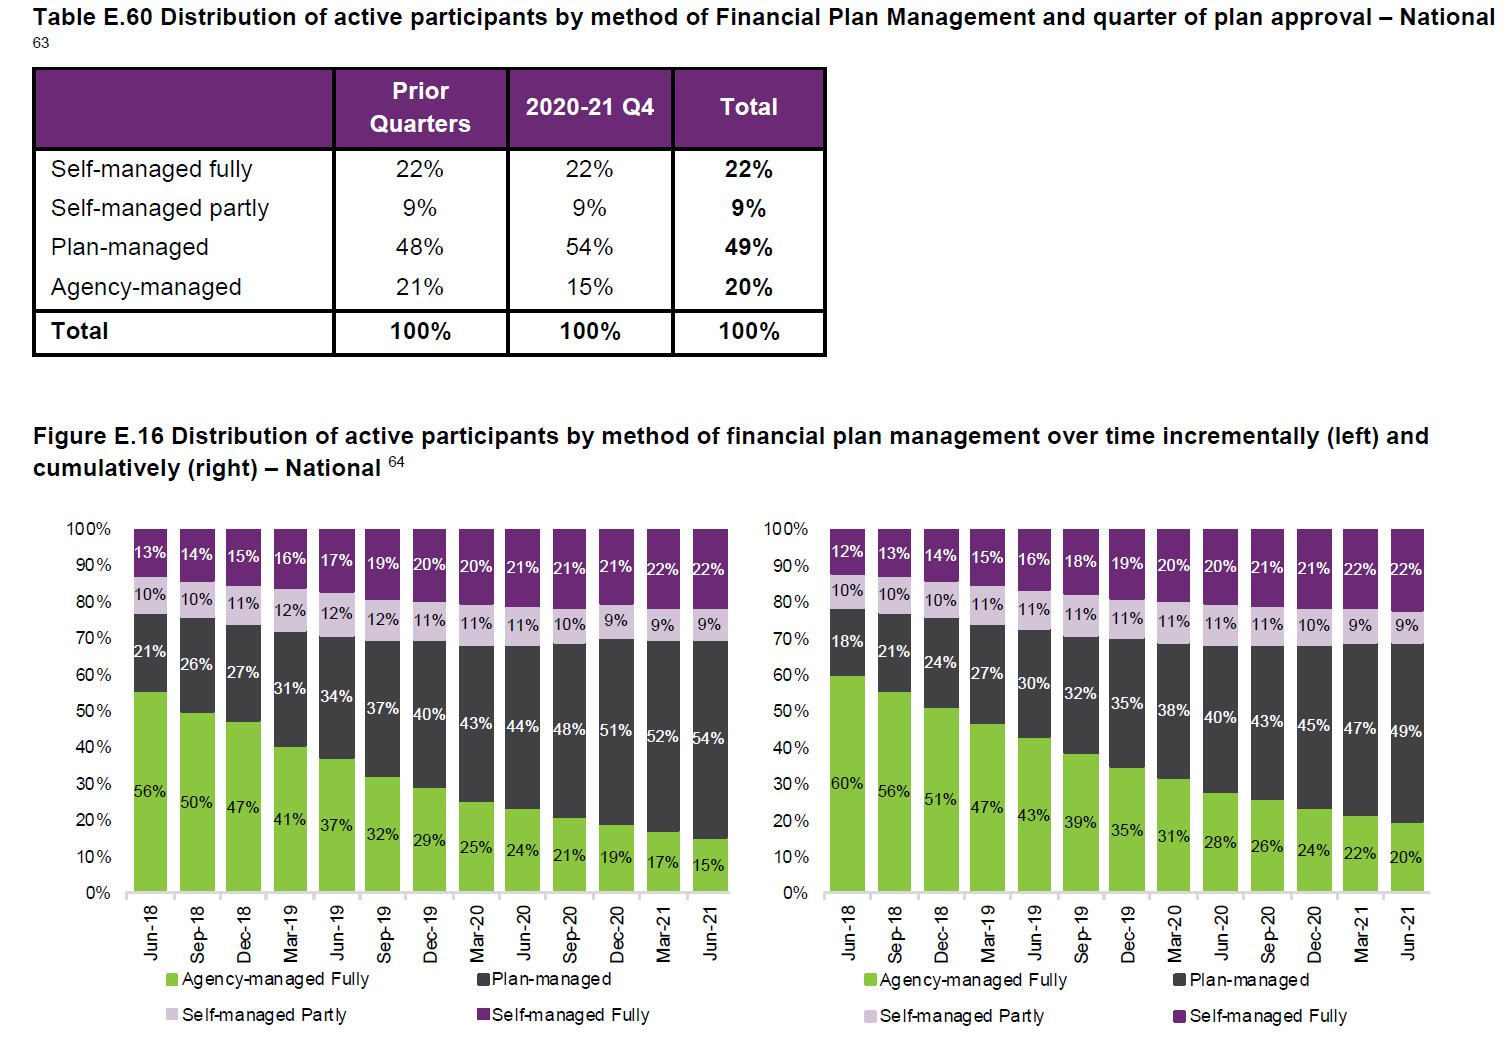
It didn’t escape DIA’s attention that the ongoing reporting of the percentage of participants using Plan Management appears to have inconsistencies with the total percentage at the end of a quarter not necessarily being the figure carried forward in the following quarterly report. For example, if we look at the table below – We can see that the total percentage of participants who used plan management nationally in the Q3 20/21 Report was 47% (3rd column from the left). However, the Q4 20/21 Report showed that the Prior Quarters value was 48% (2nd column from the left) and not the reported 47% from the previous Q3 report. DIA has produced a table using data from the previous four quarterly reports (covering the 20/21 financial year) that shows where these inconsistencies exist. These can be seen in red:
| Prior Quarters in 20-21 Q4 Report |
Total in 20-21 Q3 Report |
Prior Quarters in 20-21 Q3 Report |
Total in 20-21 |Q2 Report |
Prior Quarters in 20-21 Q2 Report |
Total in 20-21 Q1 Report |
Prior Quarters in 20-21 Q1 Report |
Total in 19-20 Q4 Report |
||||
| National | 48% | 47% | 45% | 45% | 43% | 43% | 41% | 40% | |||
| NSW | 43% | 42% | 40% | 40% | 38% | 38% | 36% | 36% | |||
| Vic | 53% | 52% | 51% | 51% | 49% | 49% | 47% | 47% | |||
| Qld | 52% | 51% | 50% | 49% | 47% | 47% | 45% | 44% | |||
| WA | 31% | 30% | 28% | 27% | 24% | 23% | 21% | 20% | |||
| SA | 59% | 59% | 57% | 57% | 54% | 54% | 52% | 52% | |||
| Tas | 46% | 44% | 40% | 39% | 35% | 33% | 30% | 29% | |||
| ACT | 40% | 40% | 39% | 39% | 37% | 40% | 38% | 37% | |||
| NT | 60% | 57% | 55% | 55% | 52% | 52% | 49% | 47% |
Although the differences are relatively small in percentage terms, the number of inconsistencies increase quarter on quarter with 7 of the 9 reported jurisdictions being impacted in the 2020/2021 Q4 Report. DIA does not assert that data is not subject to review or that underlying changes to participant characteristics should be ignored, however some form of explanatory note as to the nature of the changes would be a minimum expectation.
Without this the question of data integrity must be raised and with the aforementioned 700 plus pages of data it does raise the possibility of numerous such examples that undermines the confidence in the data driven arguments emanating from the NDIA.
Section 5 Financial Sustainability where a-b=c and nothing more
If you, like DIA, were underwhelmed by the lack of any new information in the first four sections of the Q4 Quarterly Report, then Section 5 – Financial Sustainability will be yet a further lament of a lost opportunity by the NDIA to explain their modelling and thought process in regards to future forecasting.
To save you all the time given the rest of the NDIS Q4 Quarterly Report Deep Dive to get through, we will keep this short. What the NDIA have reported is what we already know, repeat of an ongoing and familiar theme, where the Portfolio Budget Statements over time (PBS), 2017 Productivity Commission and Actual experiences are put into tables and compared. They are even so helpful that they subtract one from another to give us the difference!
What is bitterly disappointing is the repetition of the “one scenario” forecasting of the future costs of the Scheme:
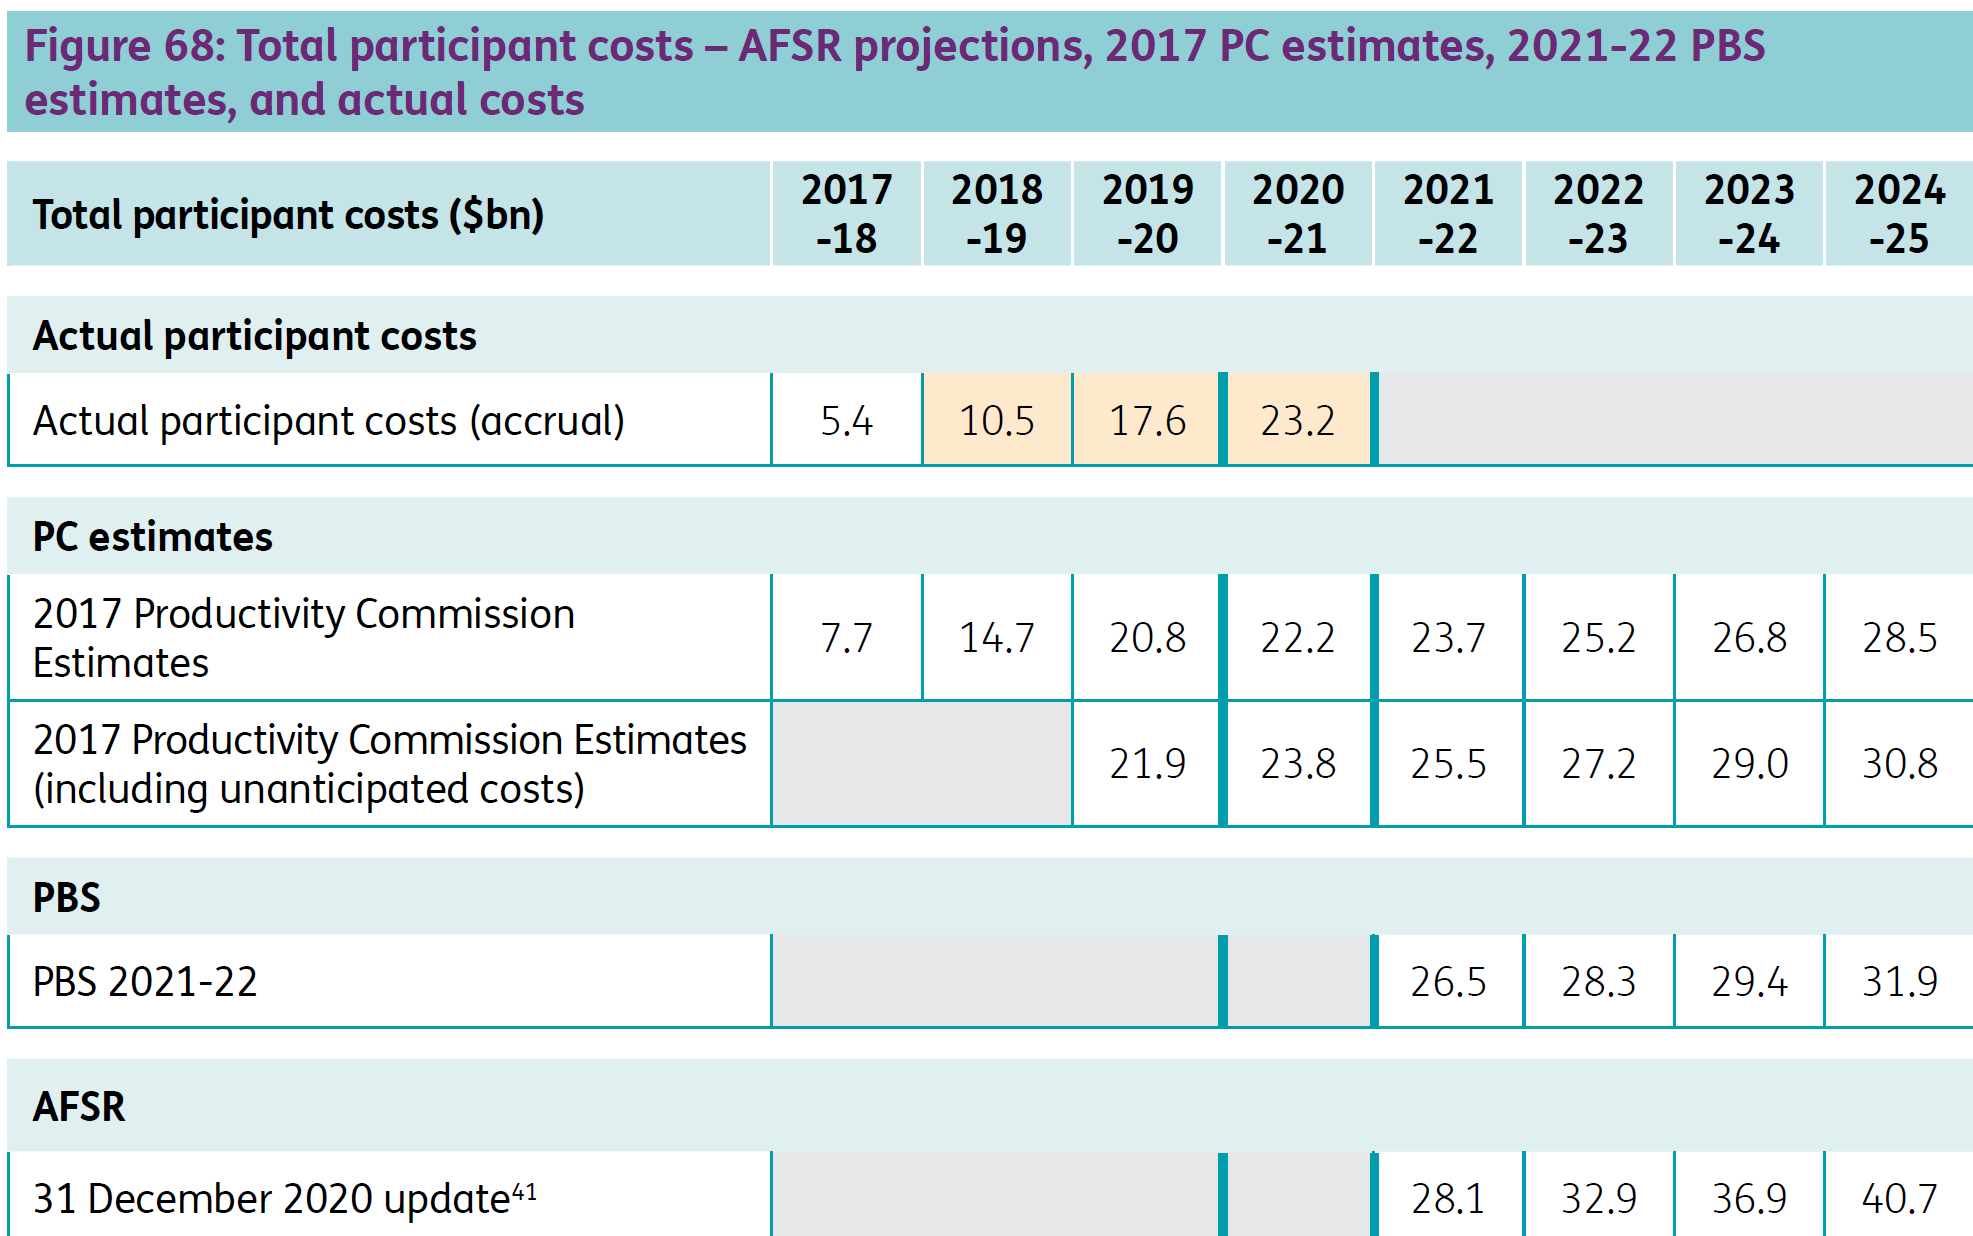
Given the resources of the NDIA’s Scheme Actuary Office (personal, data, software etc) DIA finds it a bit lacking that multi variant analysis of the future costs of the Scheme is not undertaken given the public significance of the Scheme. DIA would expect that, as a Federal Government Agency (that has responsibility to ensure public moneys are spent appropriately), the NDIA would make multi scenario analysis available with the underlying assumptions fully explained. By doing this an informed conversation can be had with all stakeholders to ensure that the Scheme delivers its desired outcomes for participants and is sustainable long into the future.
CONCLUSION
Before we look specifically at Plan Management and Support Coordination, a few closing thoughts on the 2020/2021 Q4 Quarterly Report. In summary, more of the same. As a quick snapshot of how the Scheme looks at the end of June 2020 it ticks the boxes but in the current climate it once again fails to provide the public information the community continues to call for so that an informed and respectful ongoing working relationship, built on trust, can be established for the good of the Scheme, its participants and Australian society.
PLAN MANAGEMENT AND SUPPORT COORDINATION DATA
Intermediaries continue to increase in popularity with Participants, who see the undeniable value and importance Plan Management and Support Coordination brings to the Scheme.
PLAN MANAGEMENT NATIONALLY
- In the last quarter 54% of participants elected to plan manage all or part of their plan nation-wide, an increase of 6% from prior quarters.
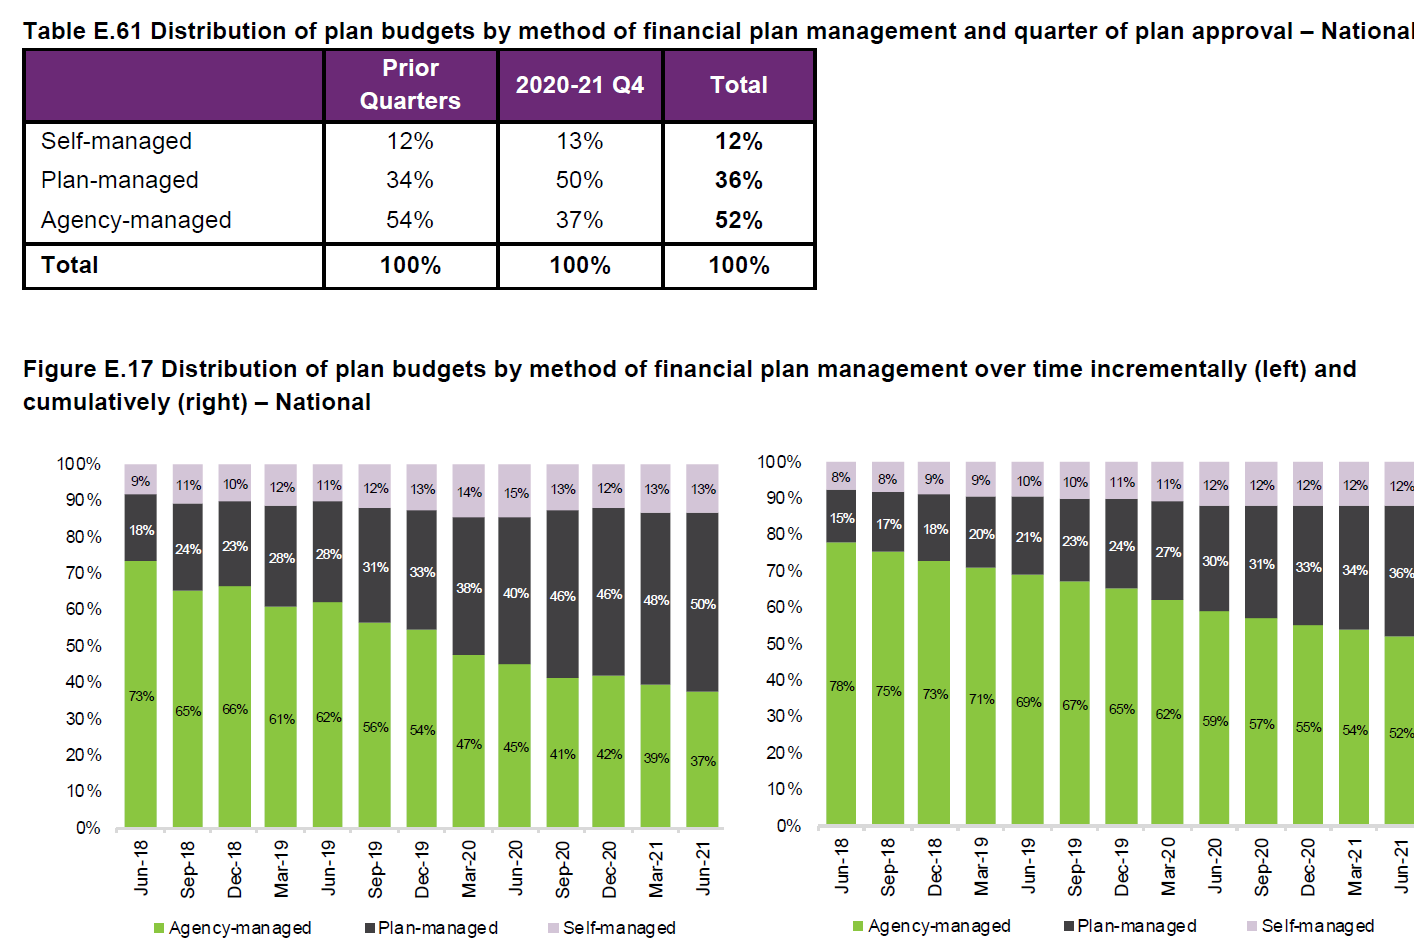
- In the last quarter 50% of plan budgets were plan managed, an increase of 16% from prior quarters.
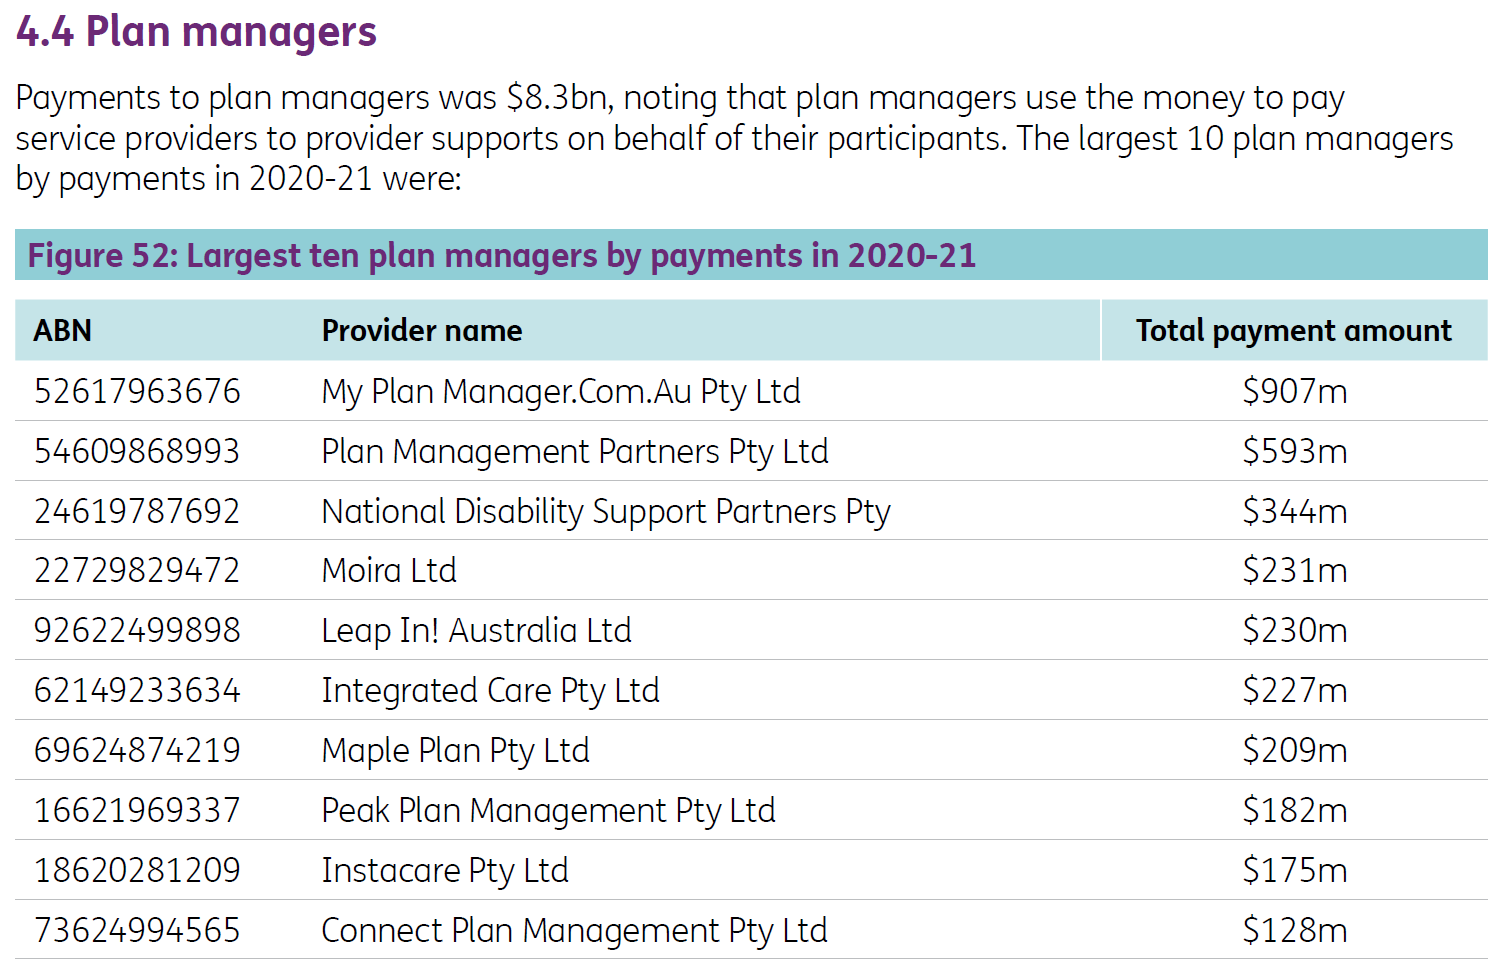
- The NDIA have published data on the top ten Plan Management providers by value of claims with the overwhelming majority being members of DIA.
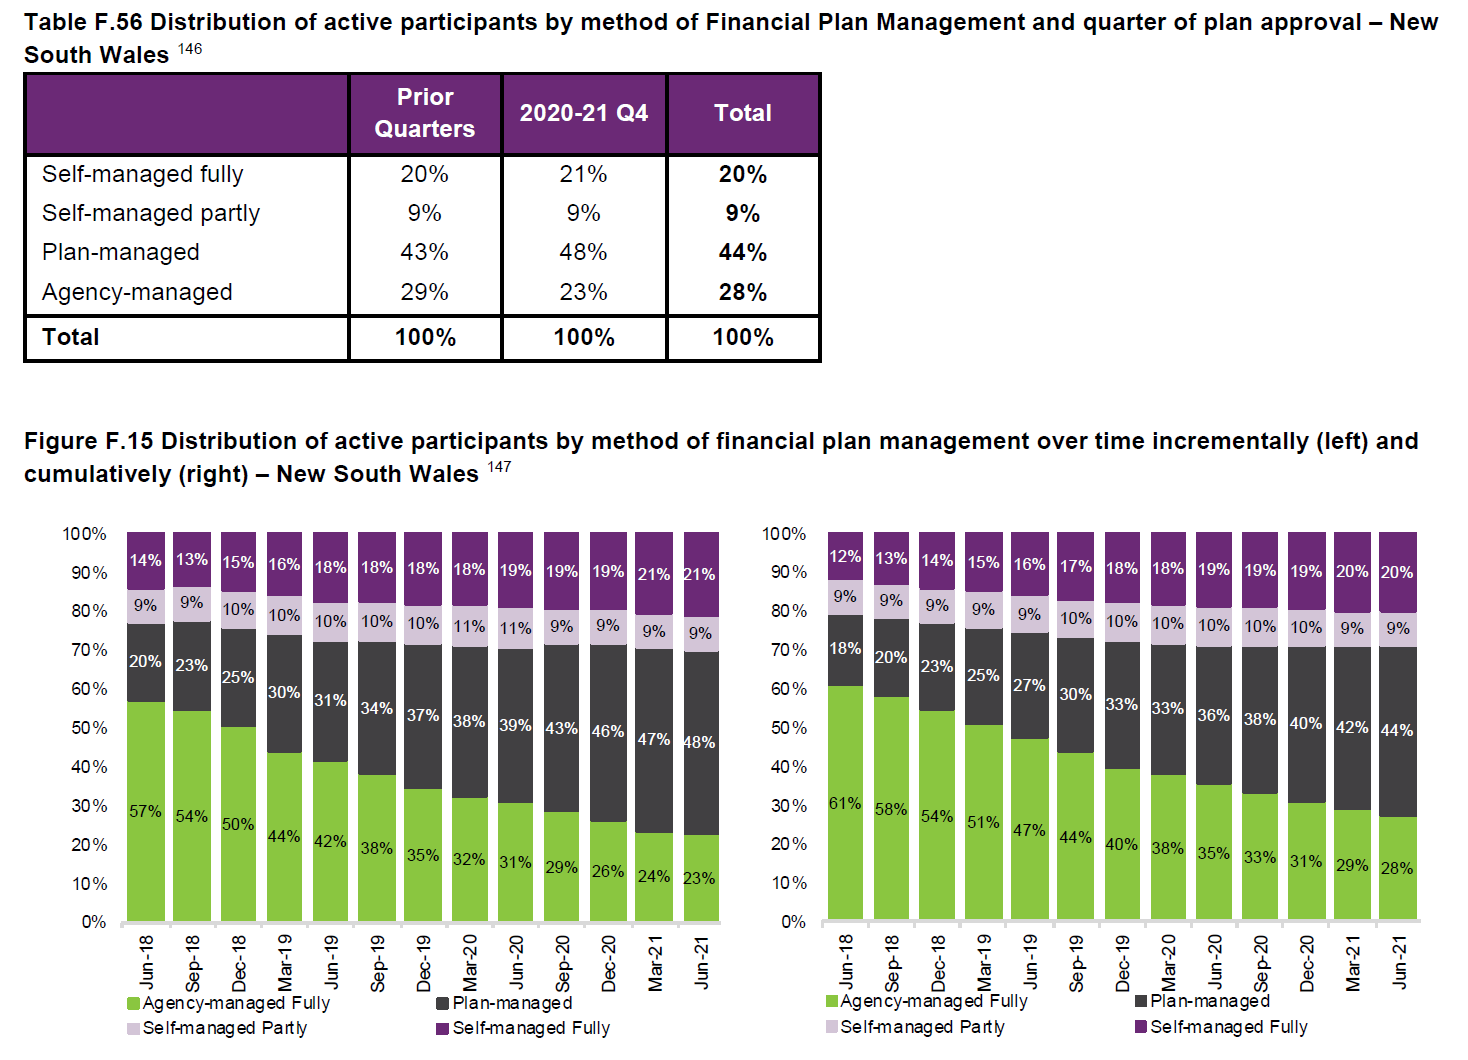
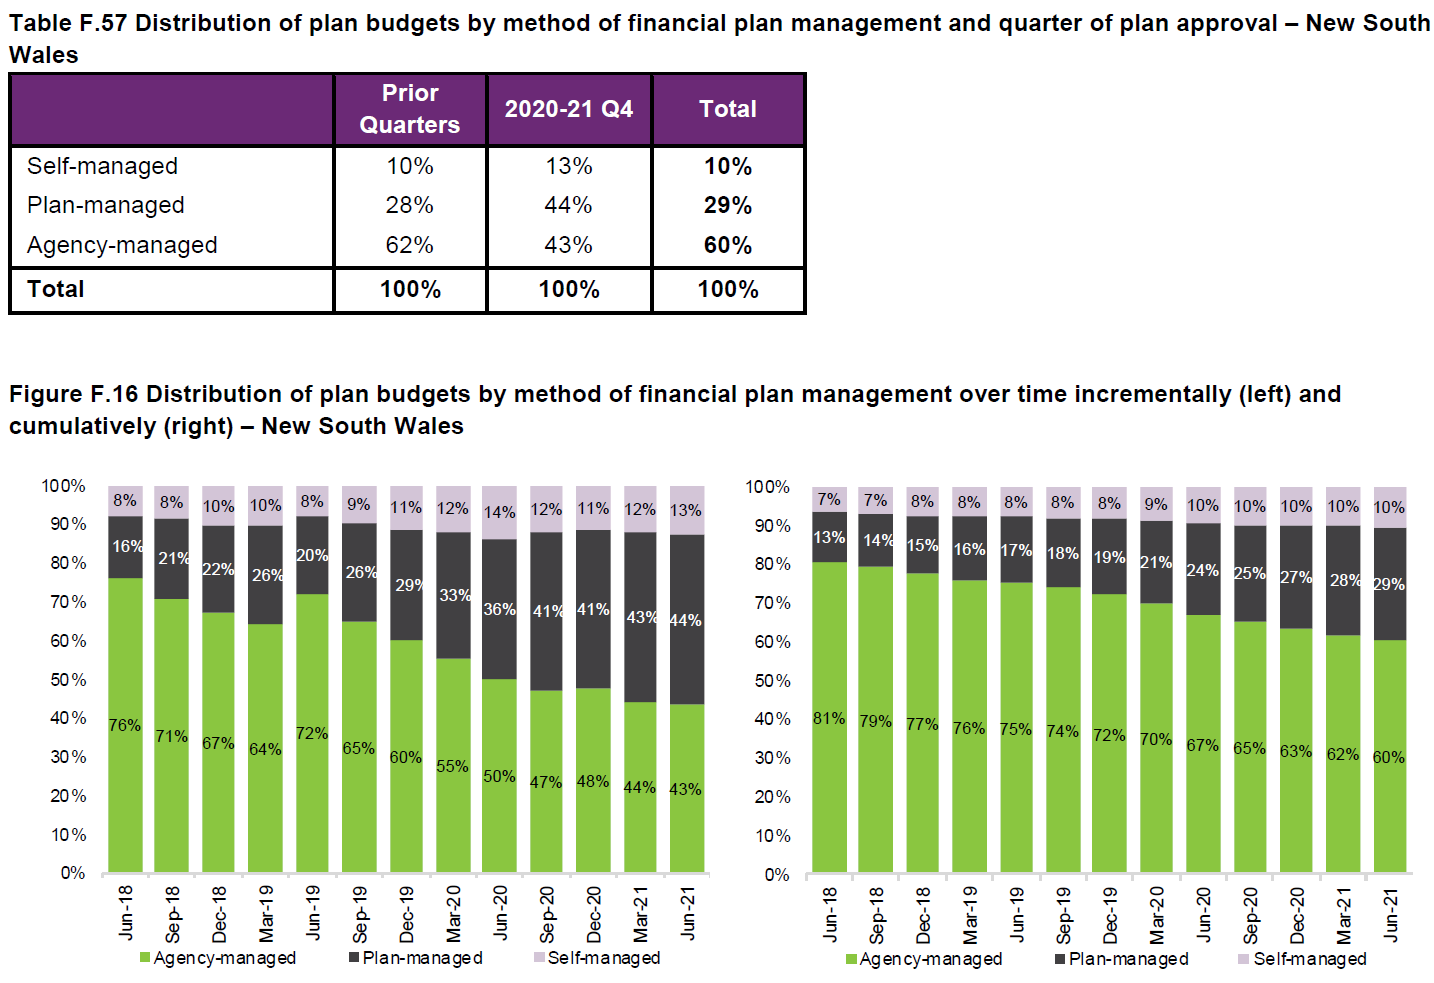
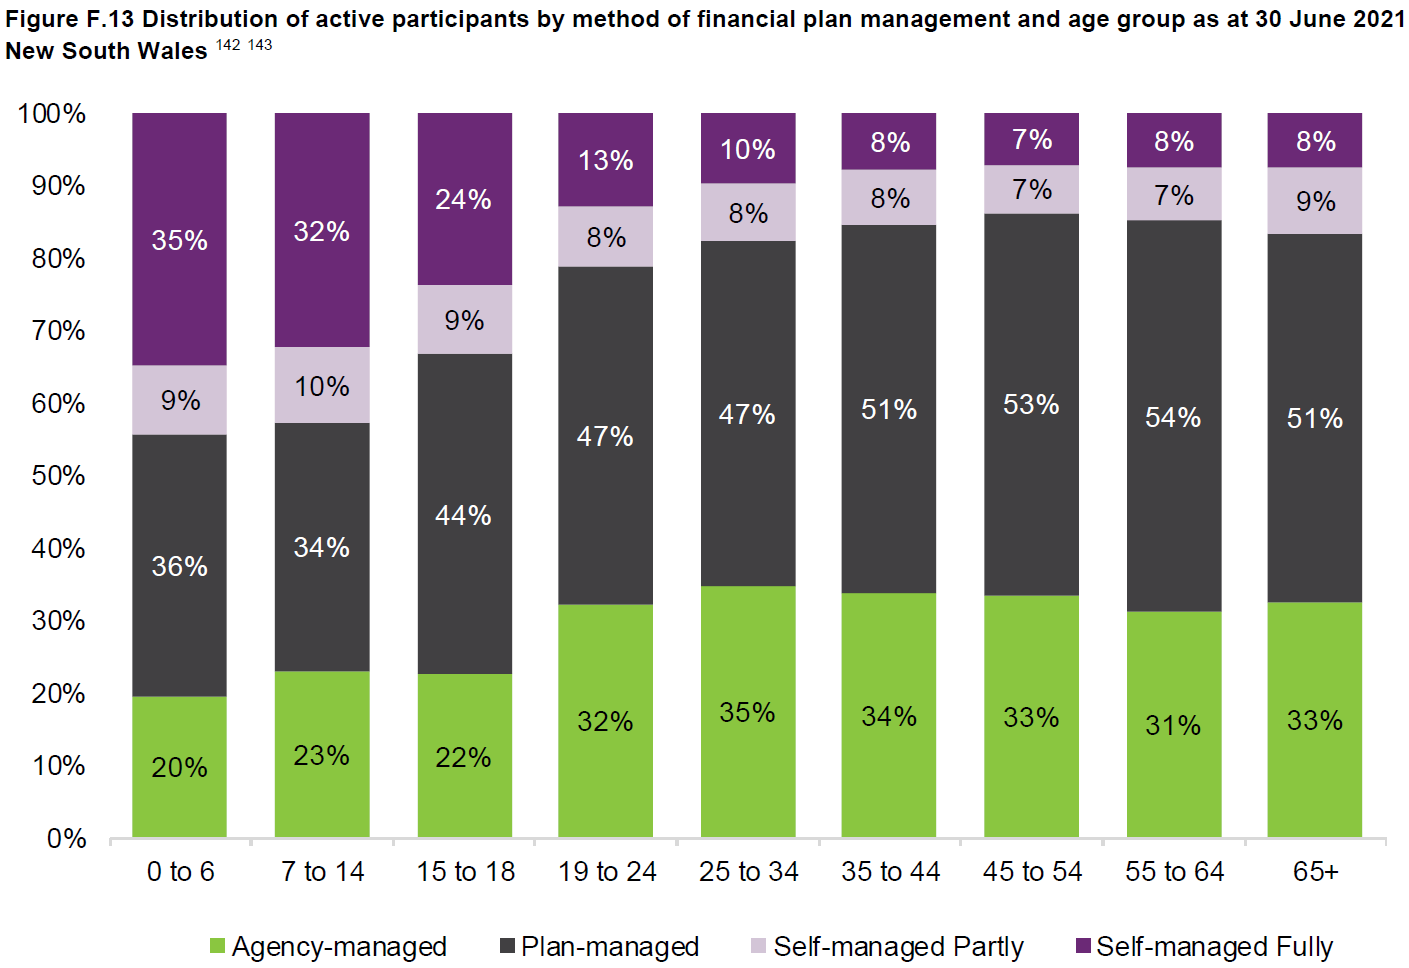
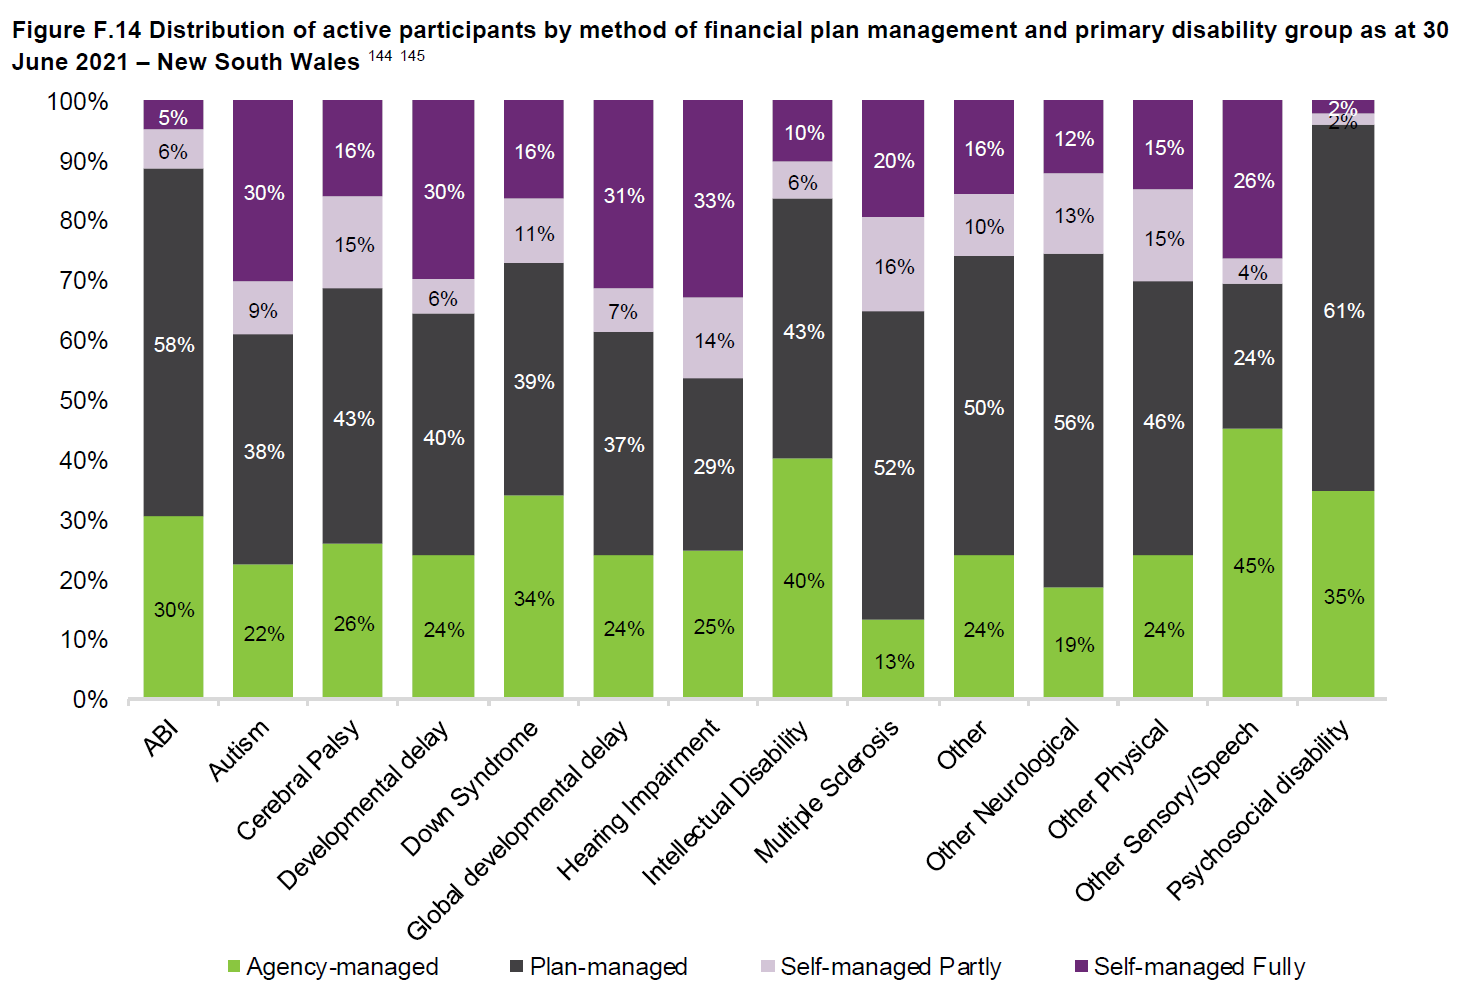
NEW SOUTH WALES - PLAN MANAGEMENT
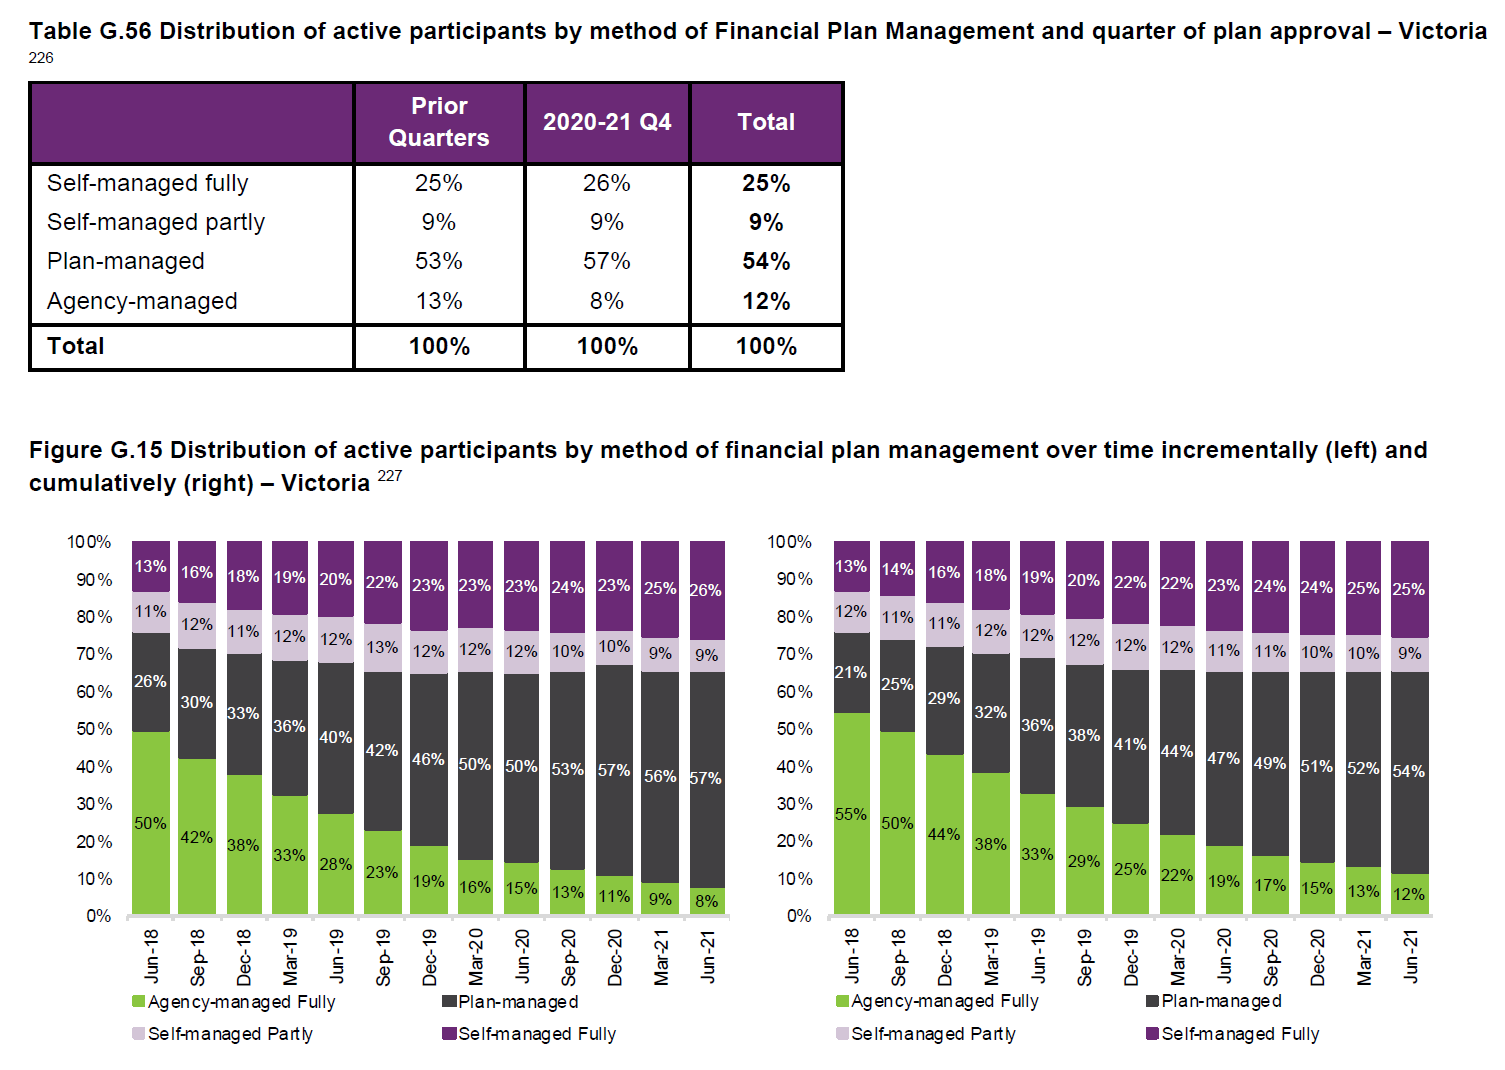
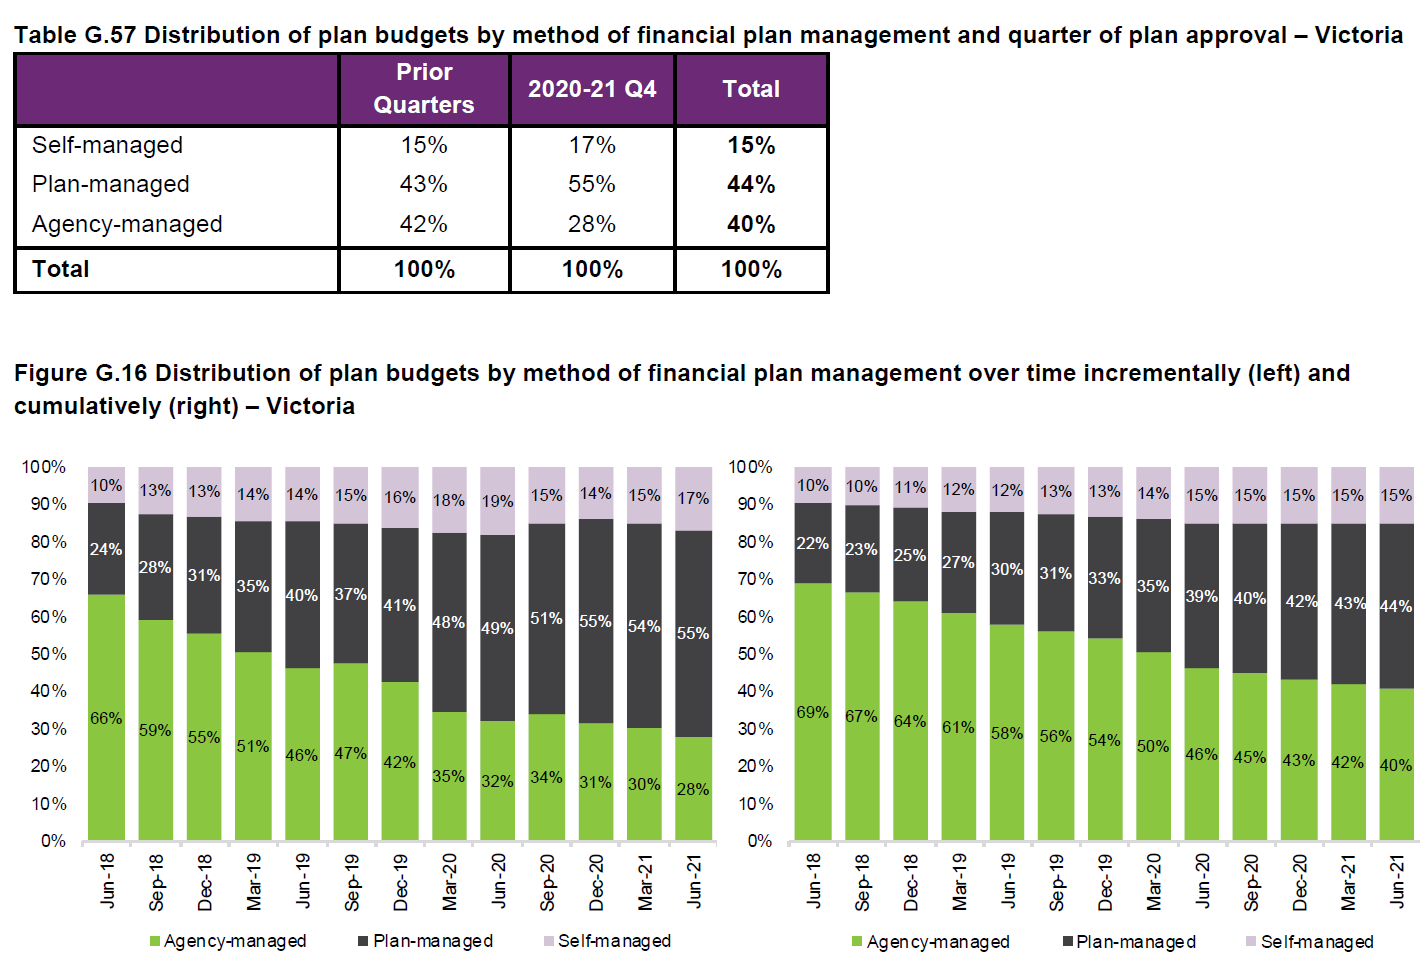
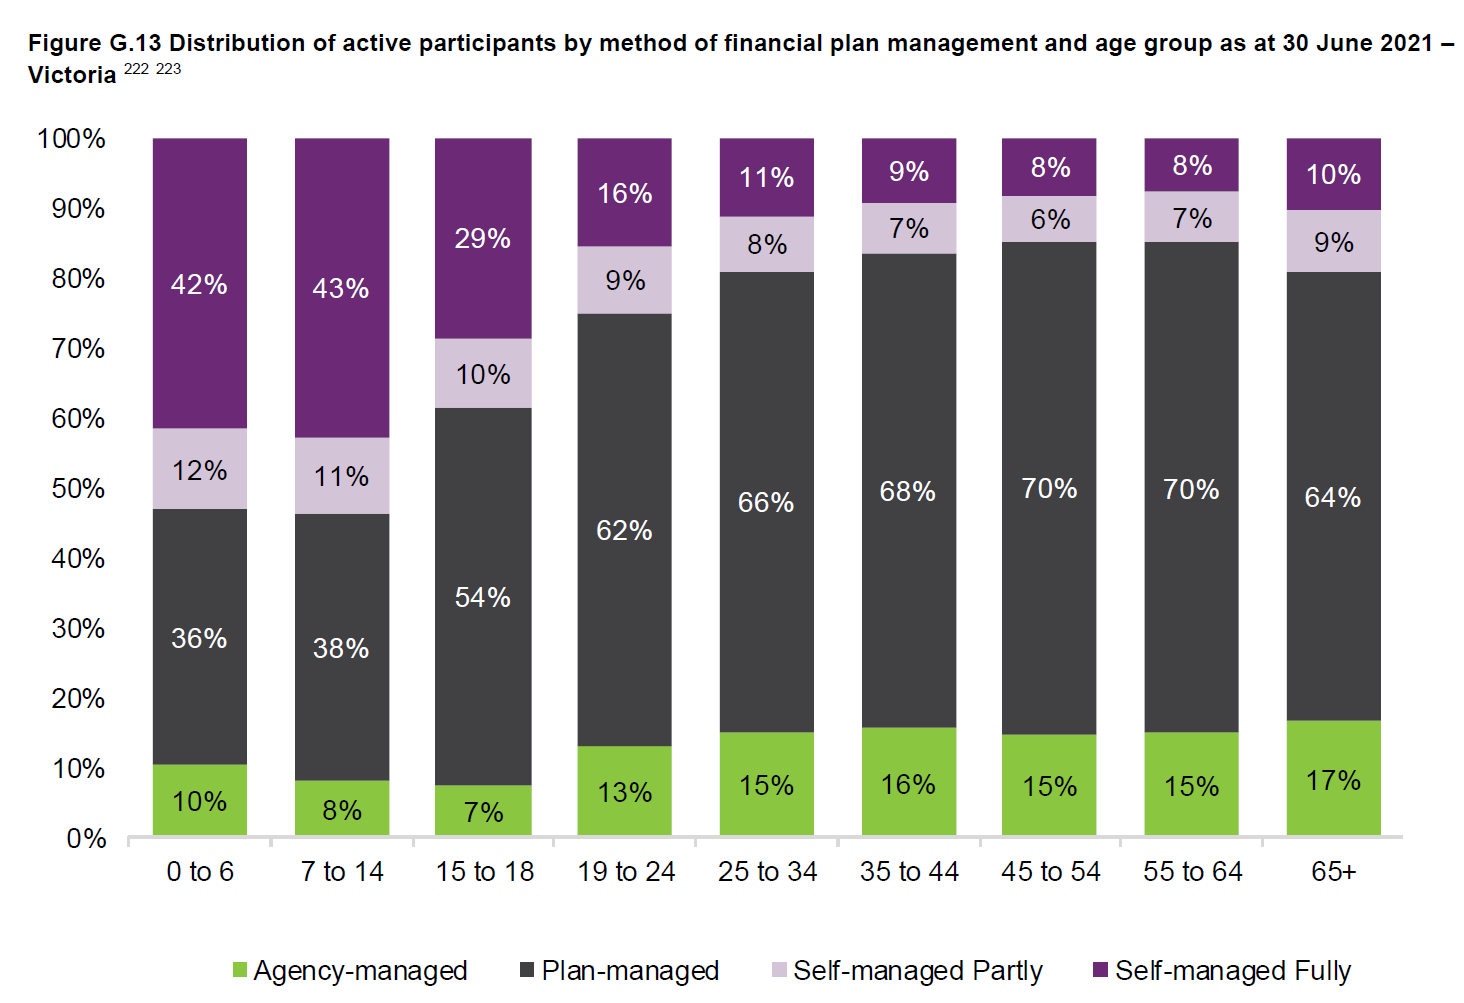
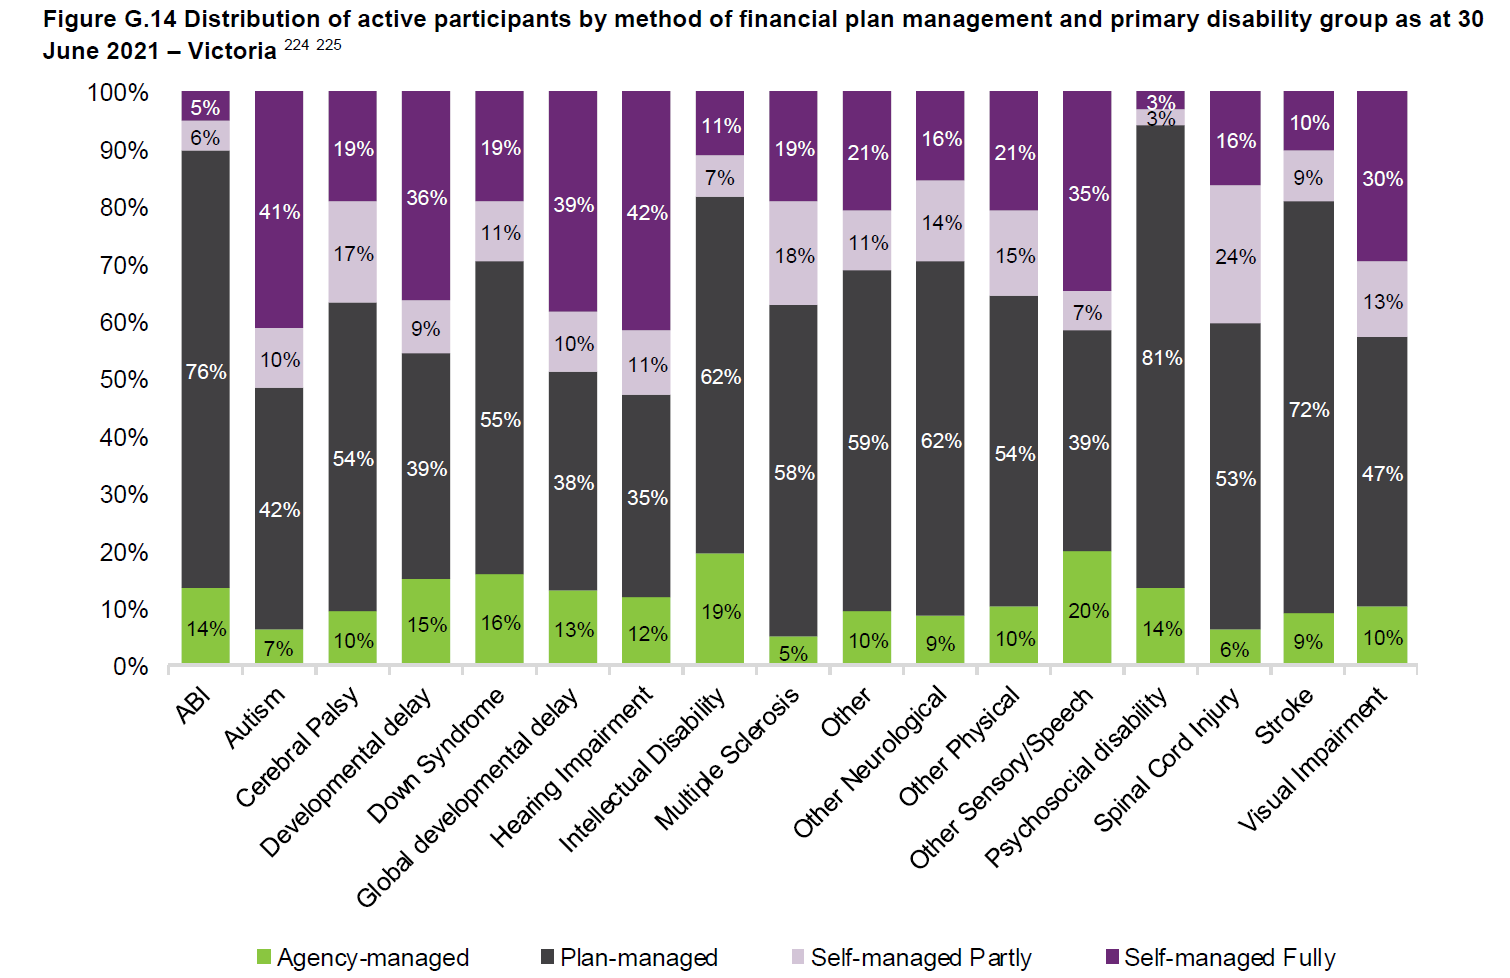
VICTORIA - PLAN MANAGEMENT
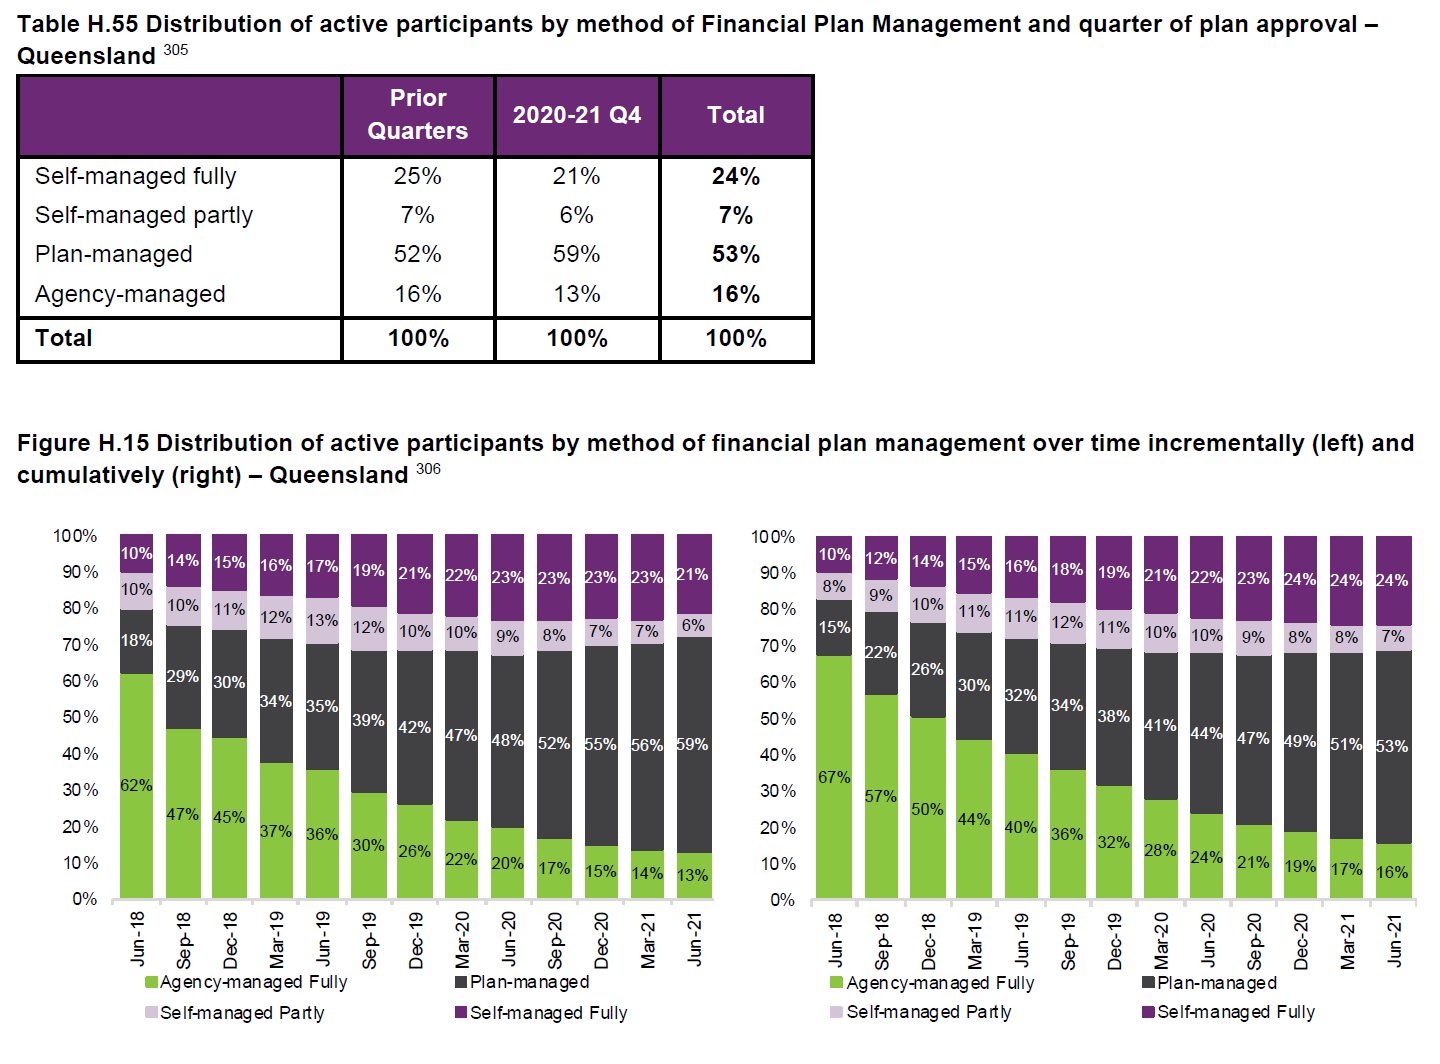
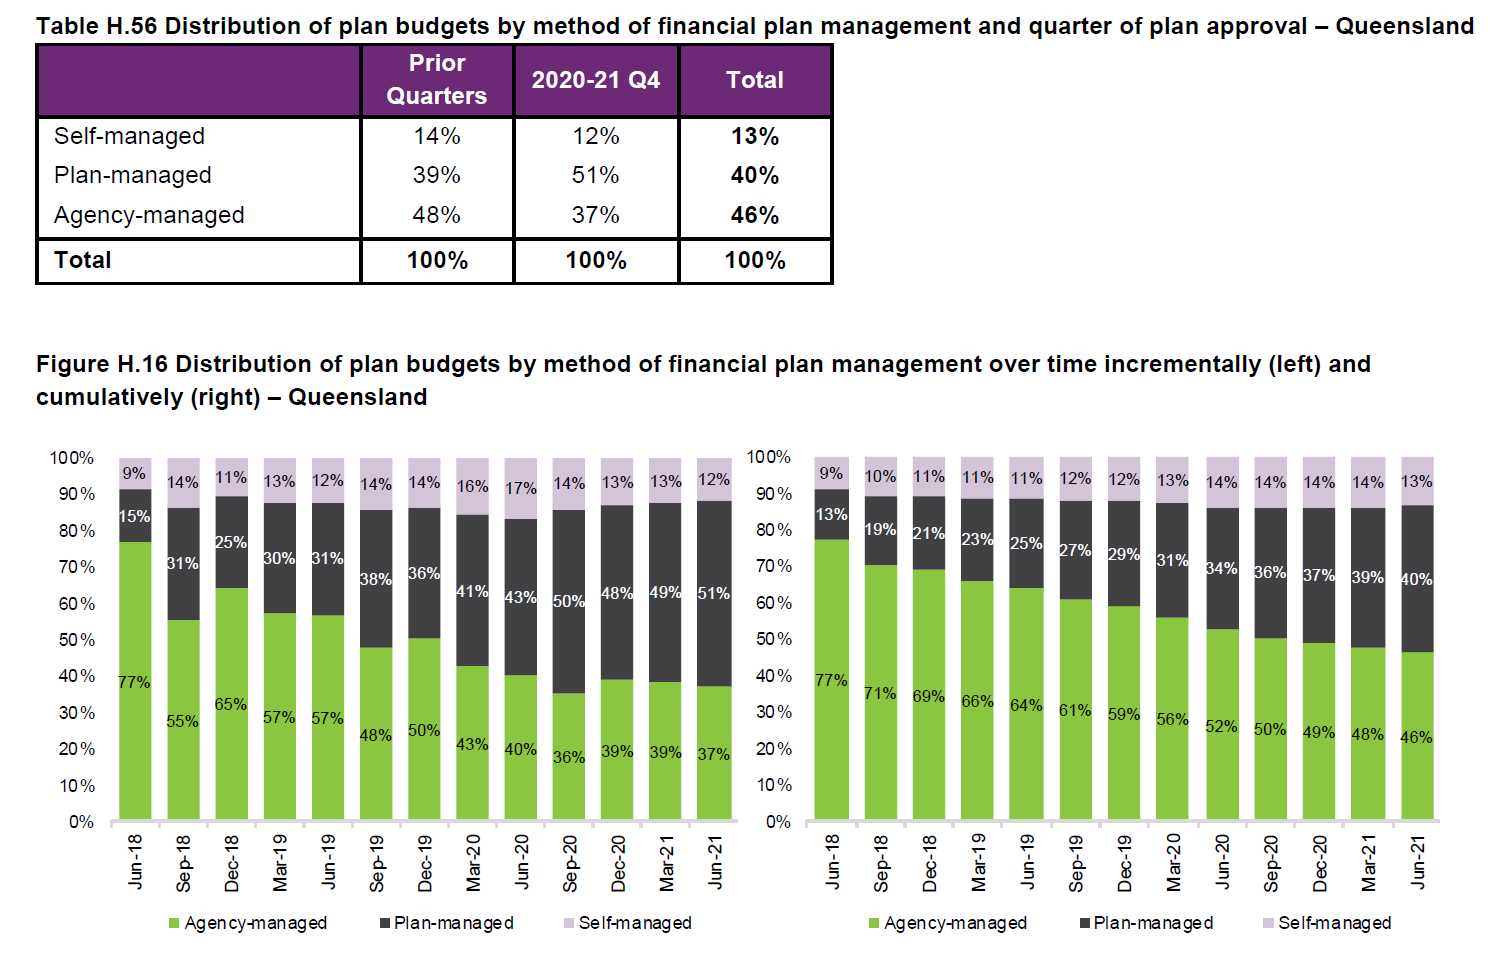
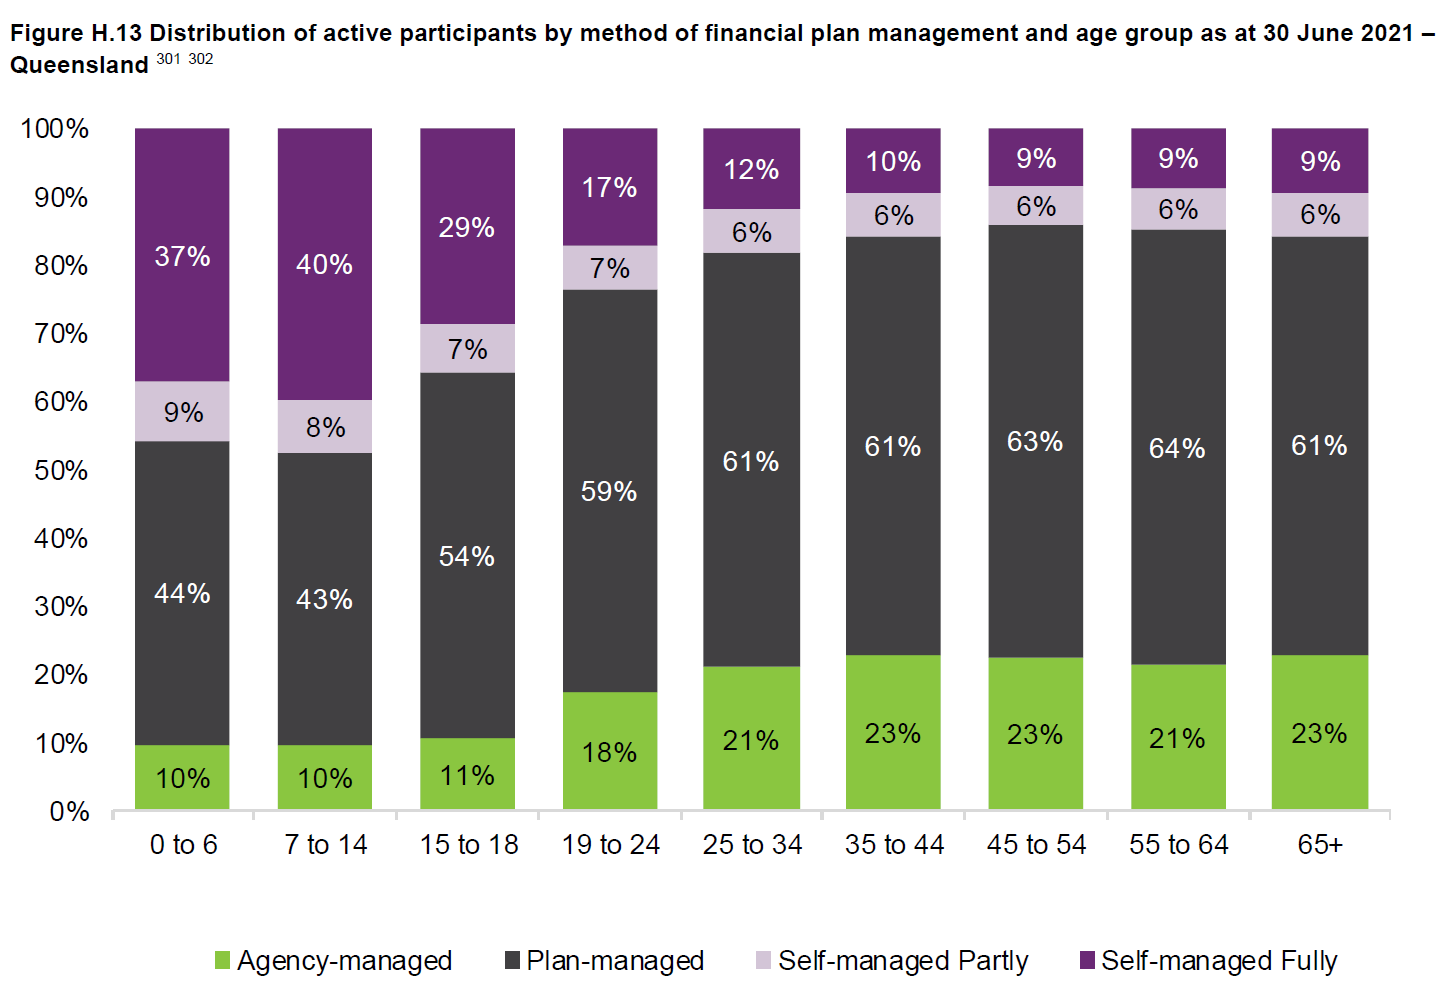
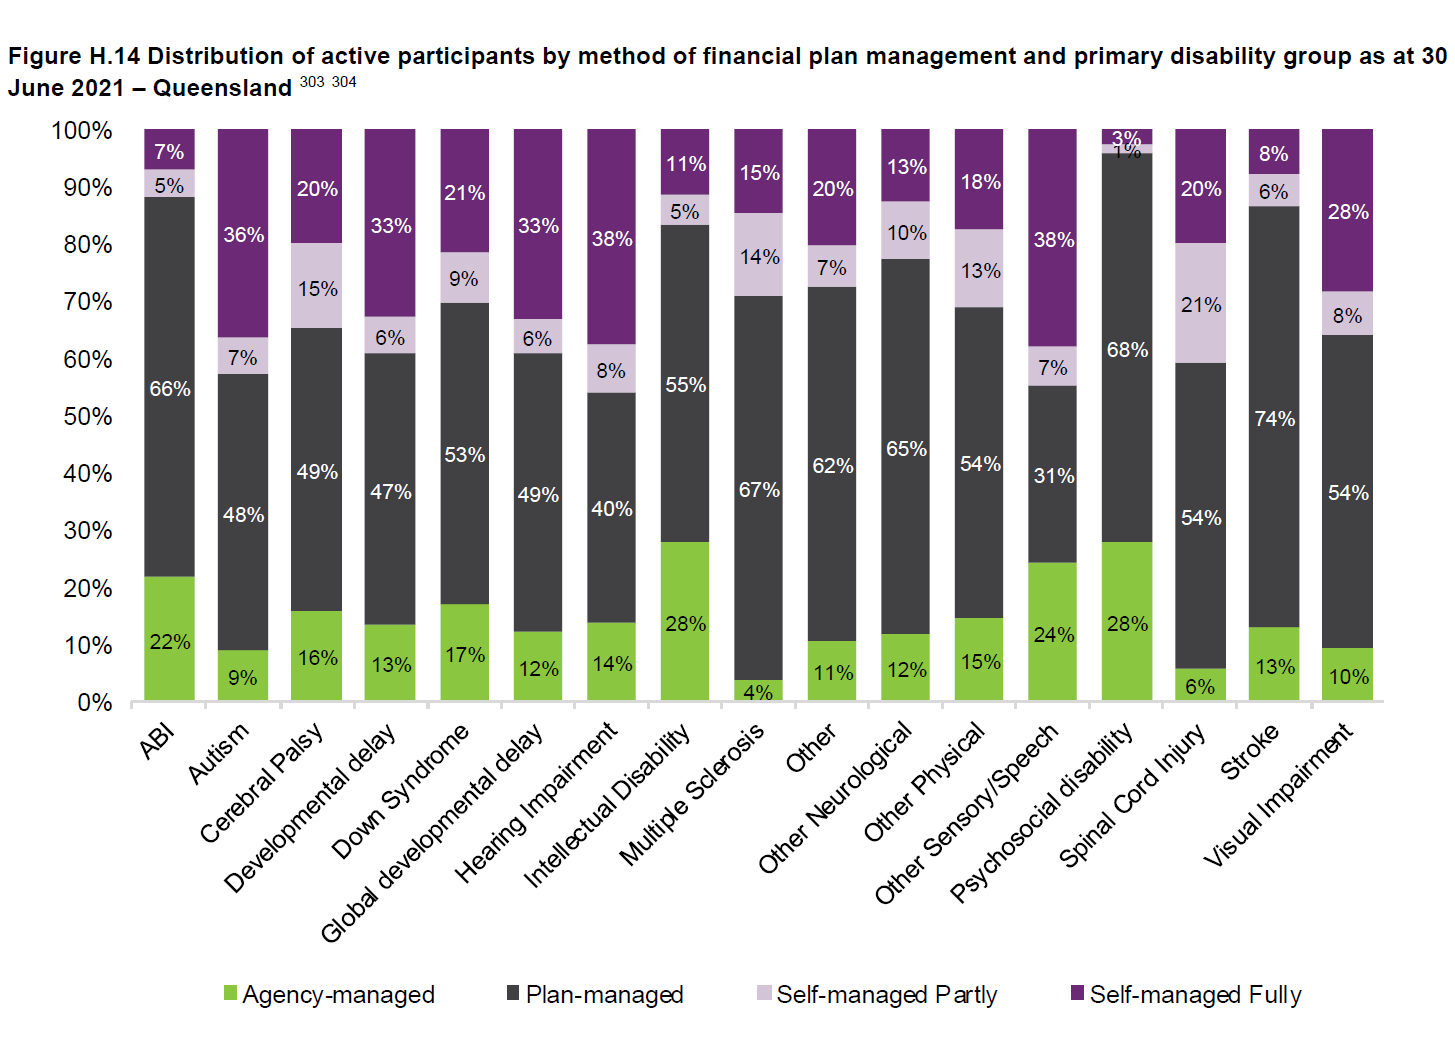
QUEENSLAND - PLAN MANAGEMENT
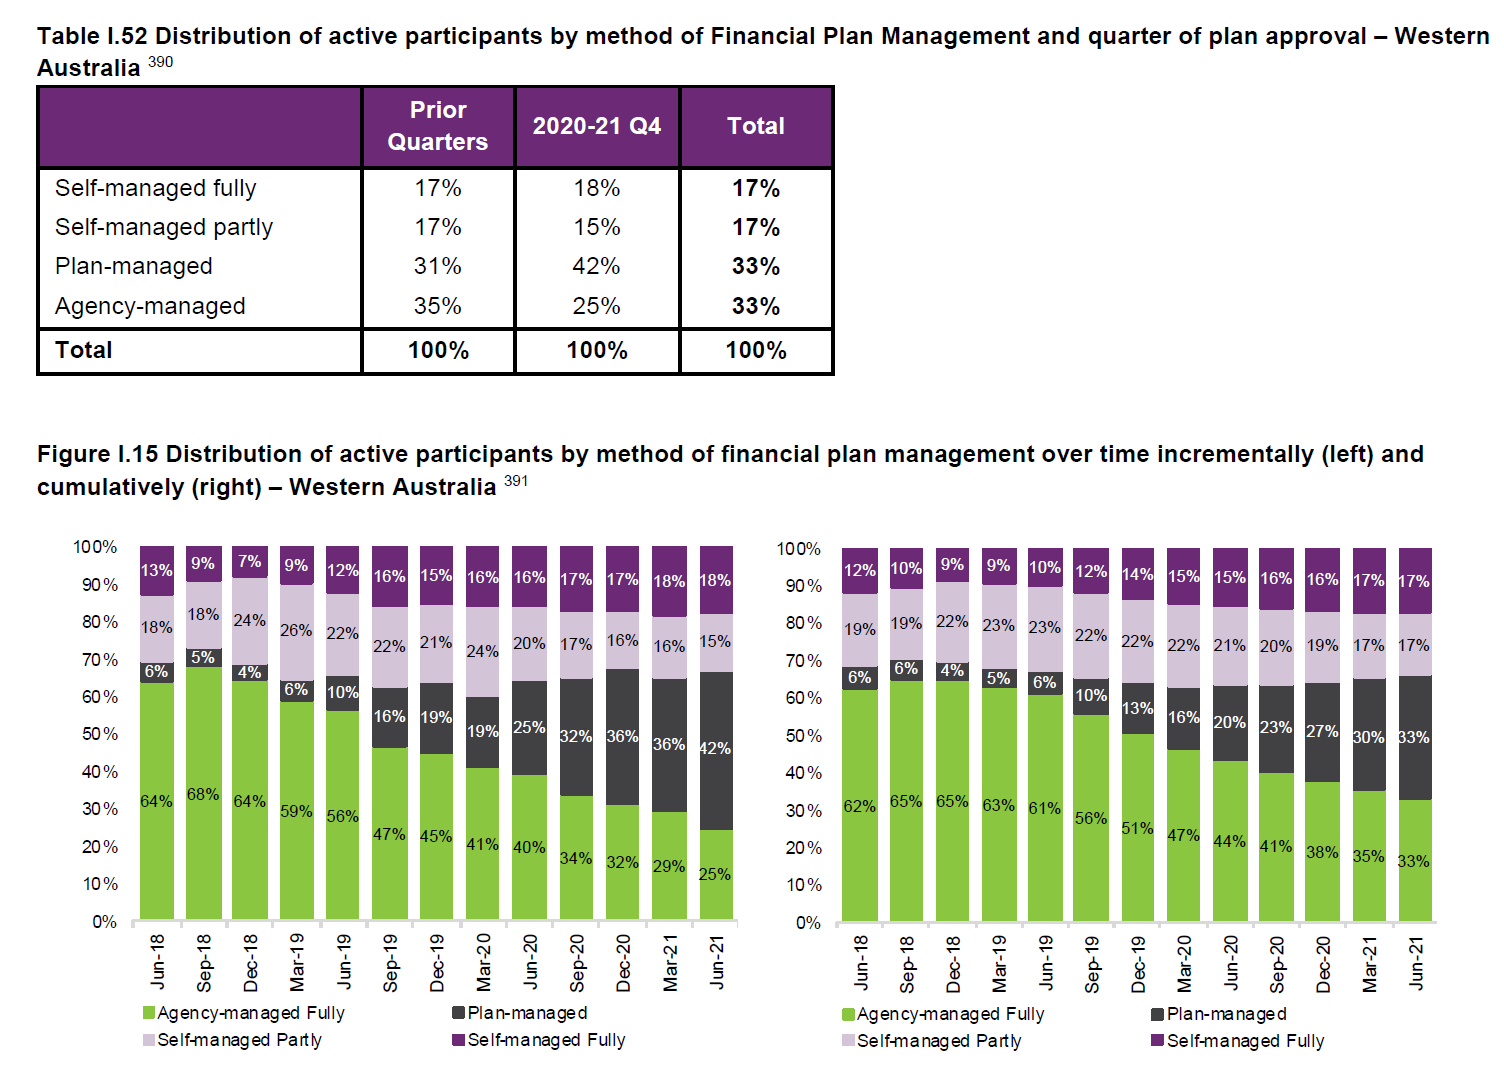
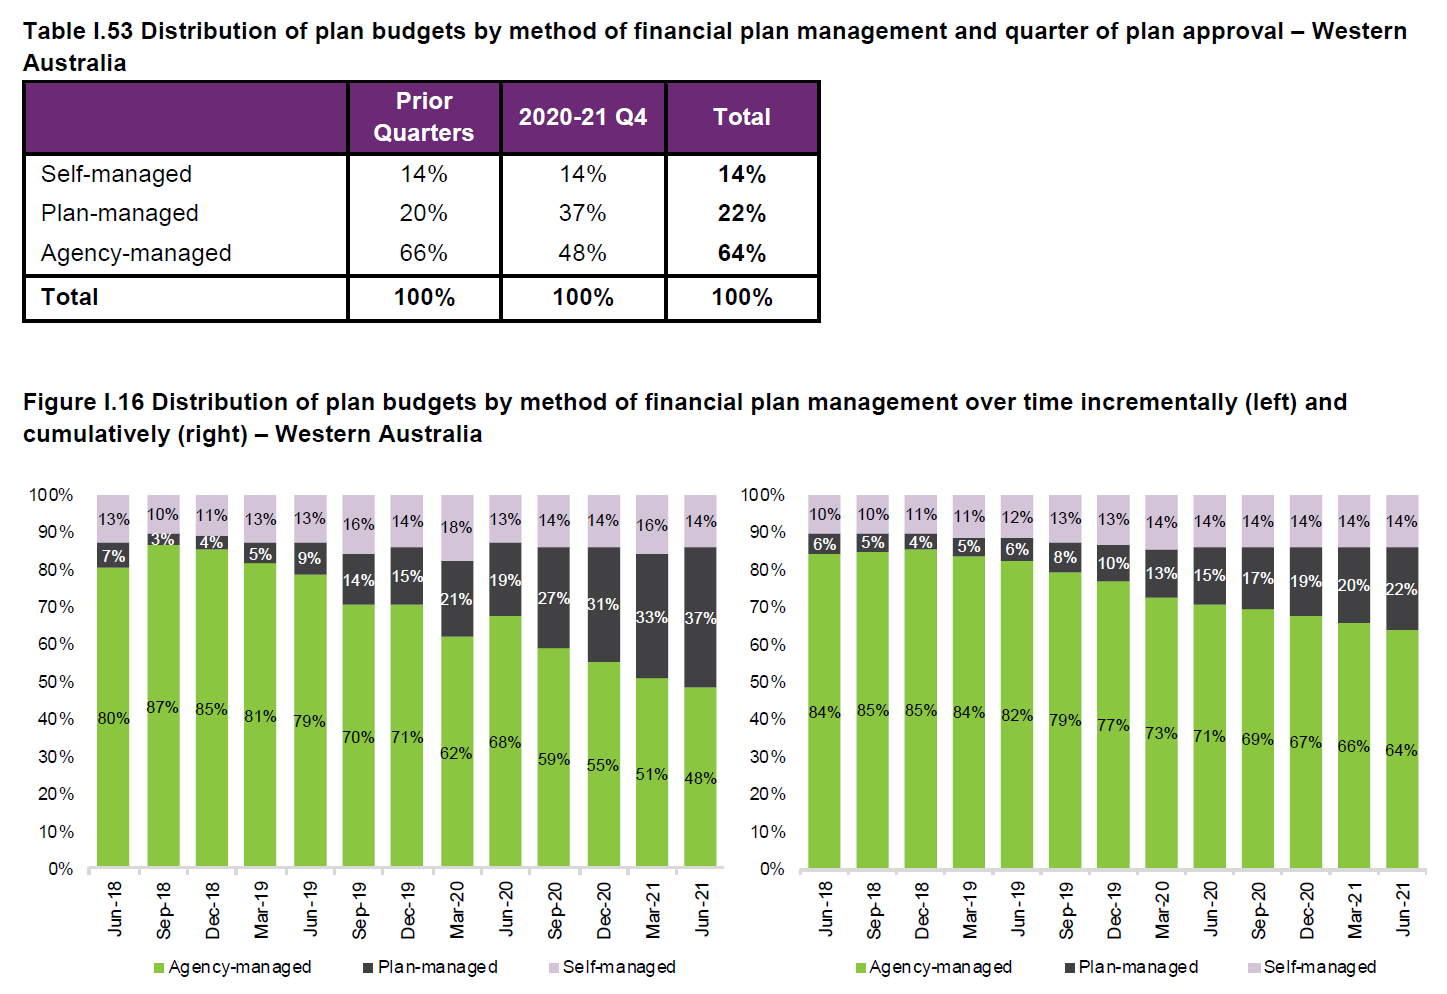
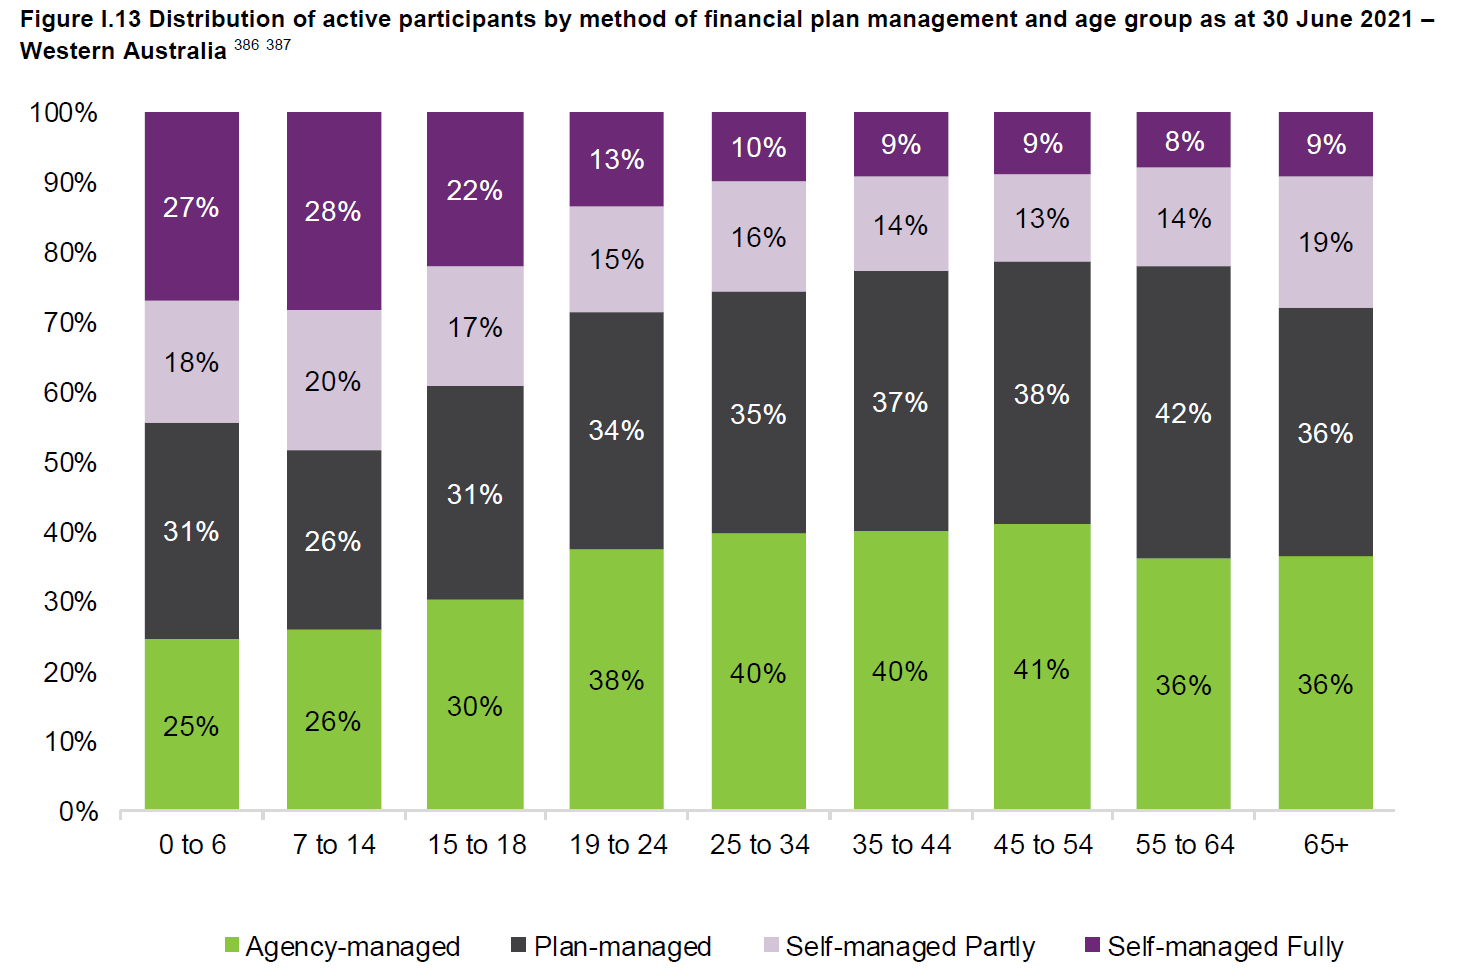
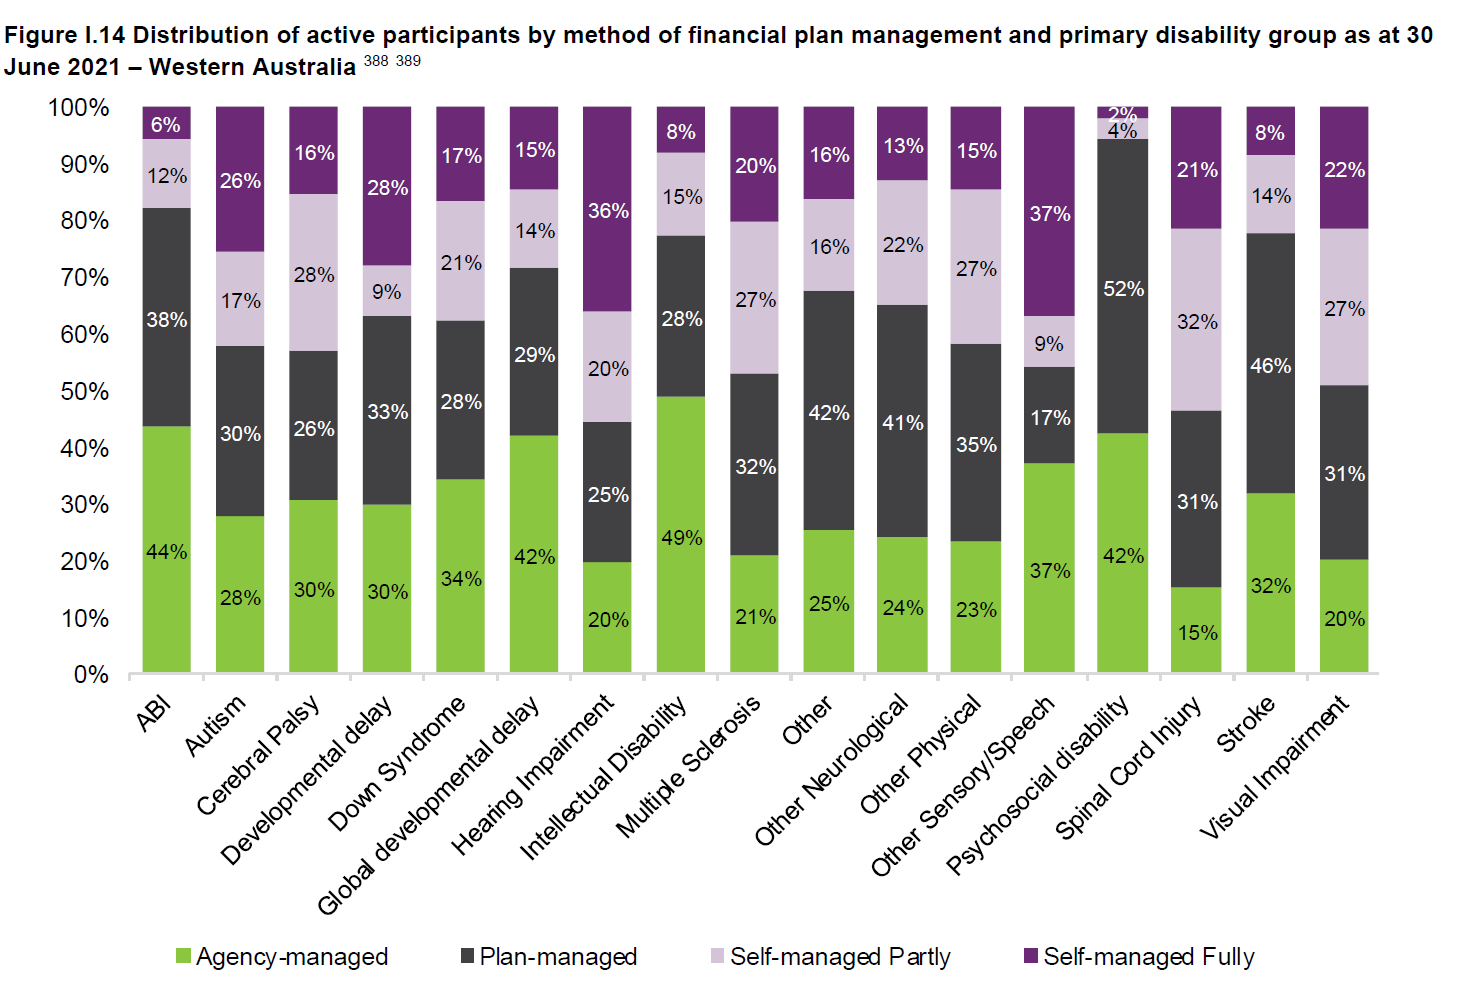
WESTERN AUSTRALIA - PLAN MANAGEMENT
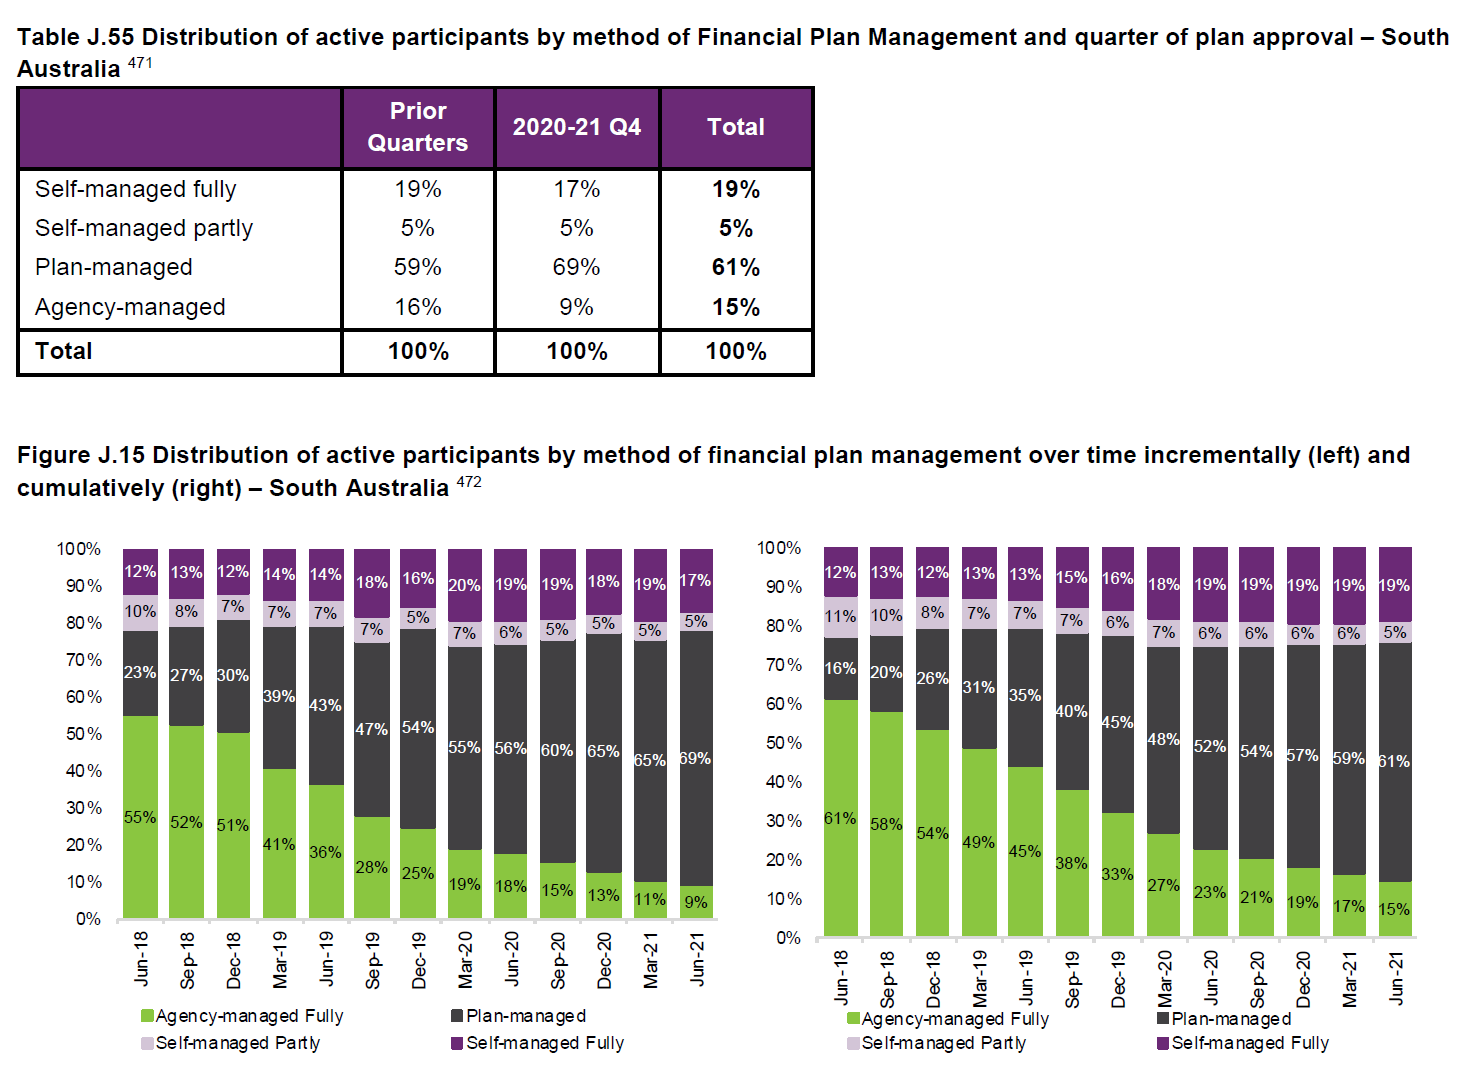
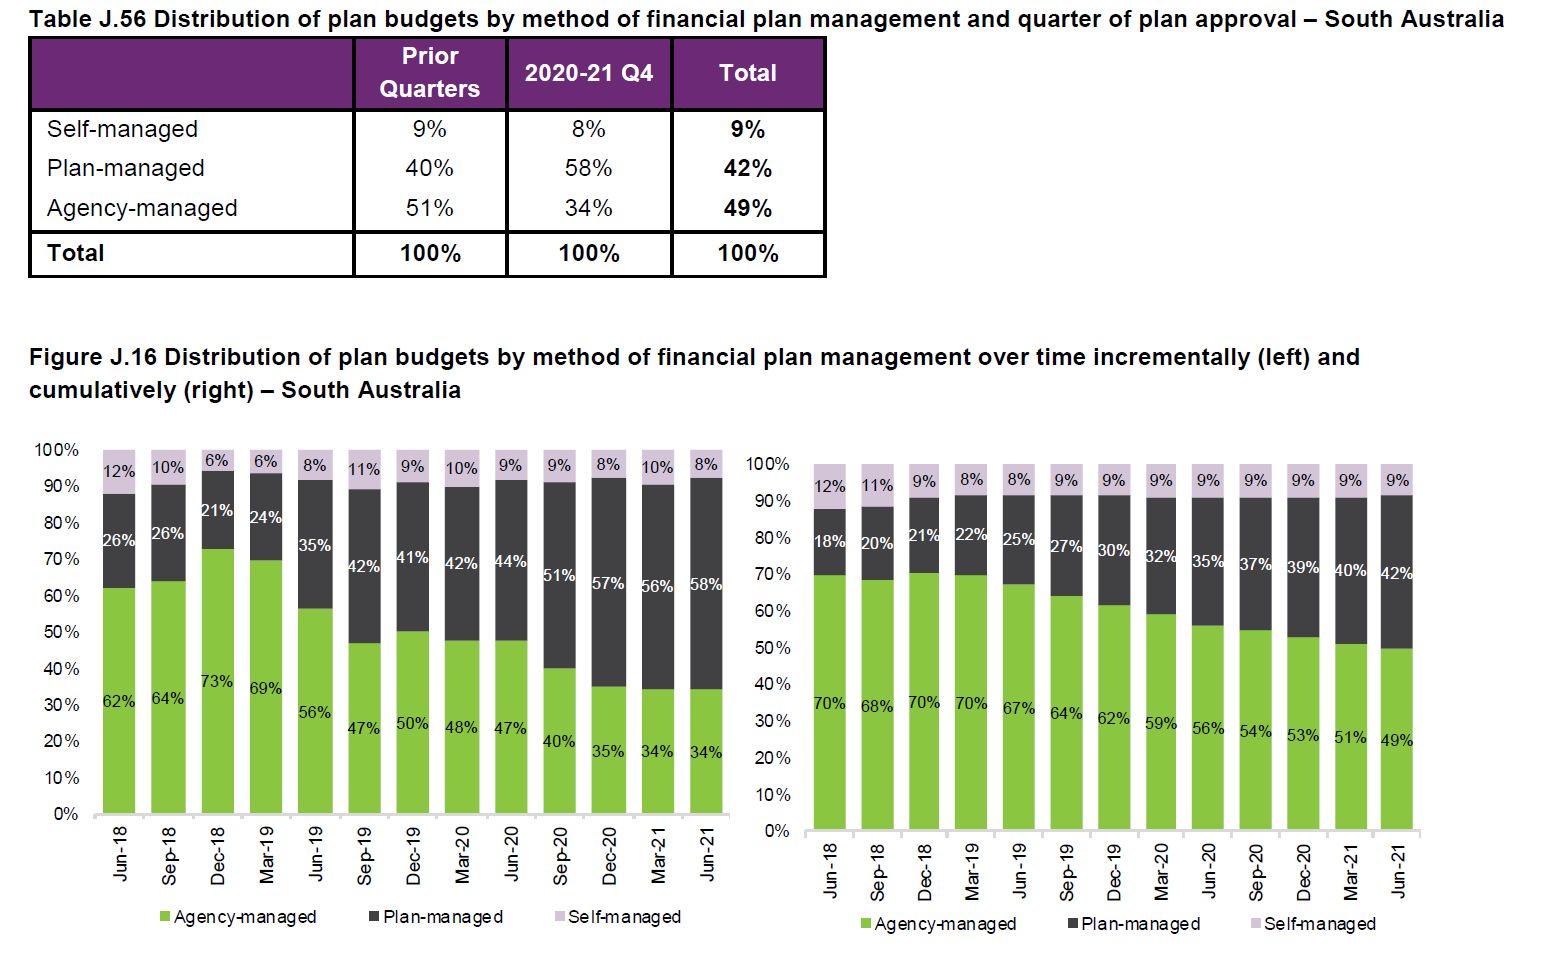
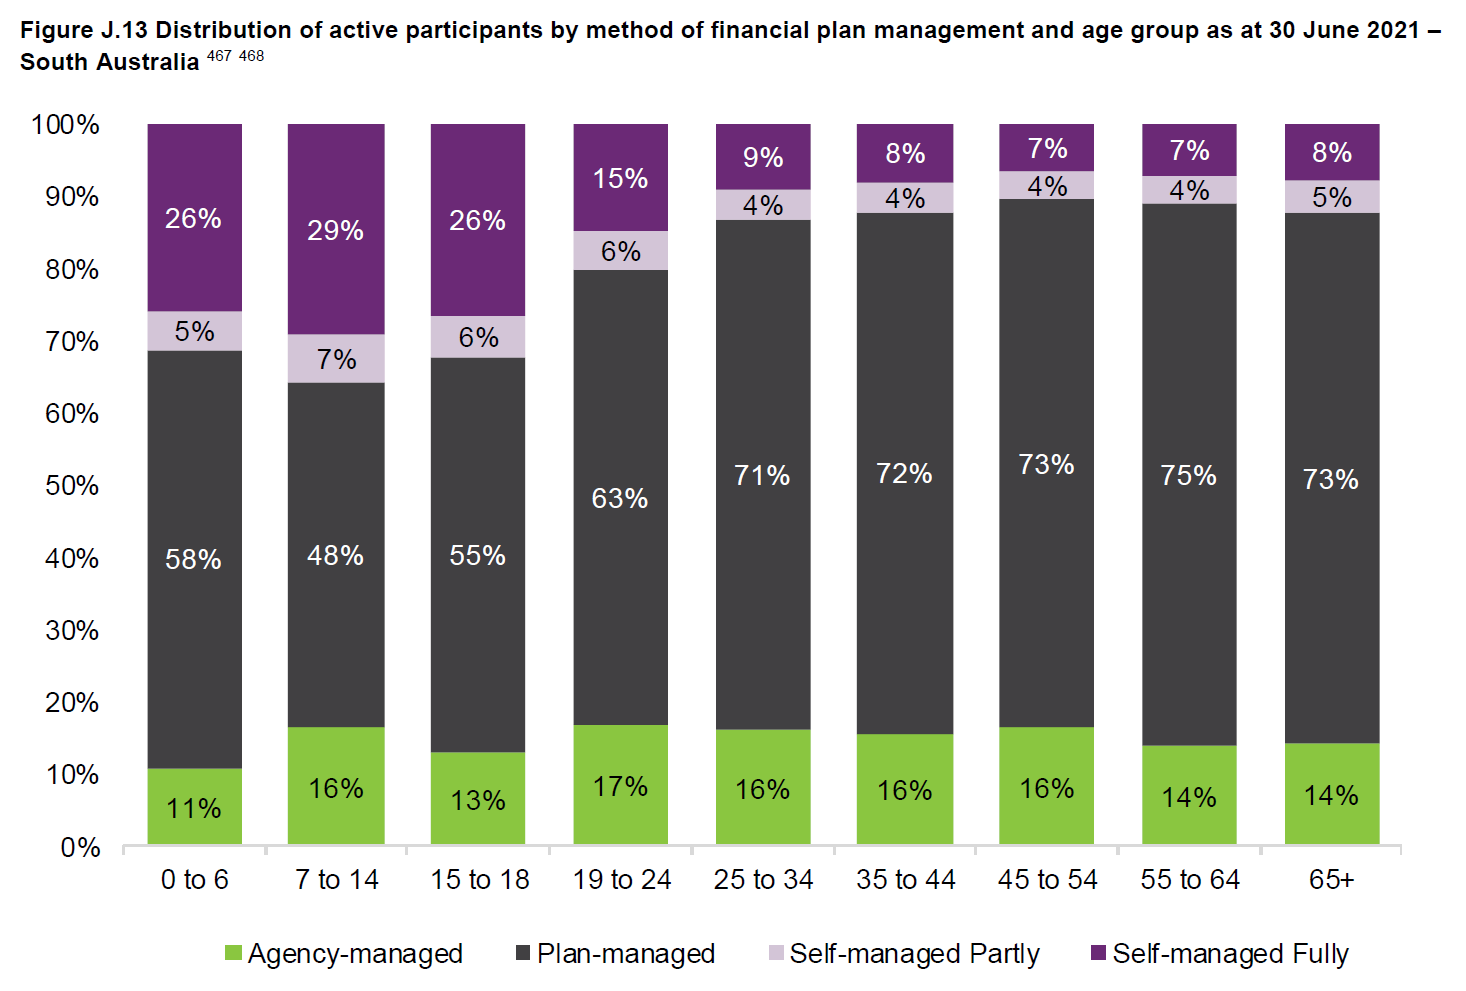
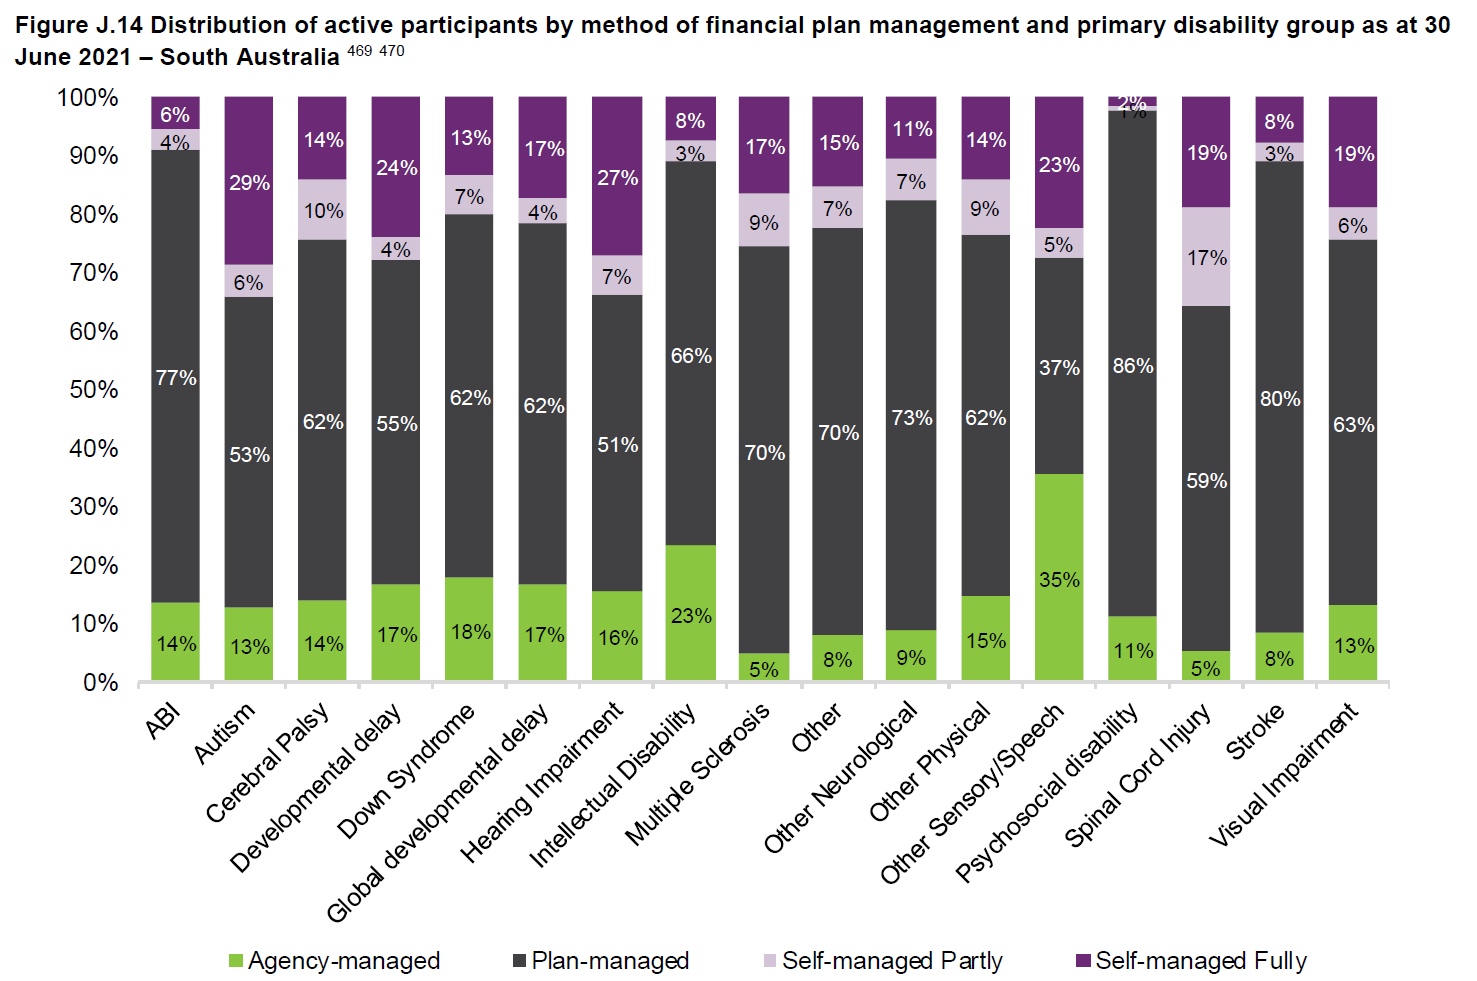
SOUTH AUSTRALIA - PLAN MANAGEMENT
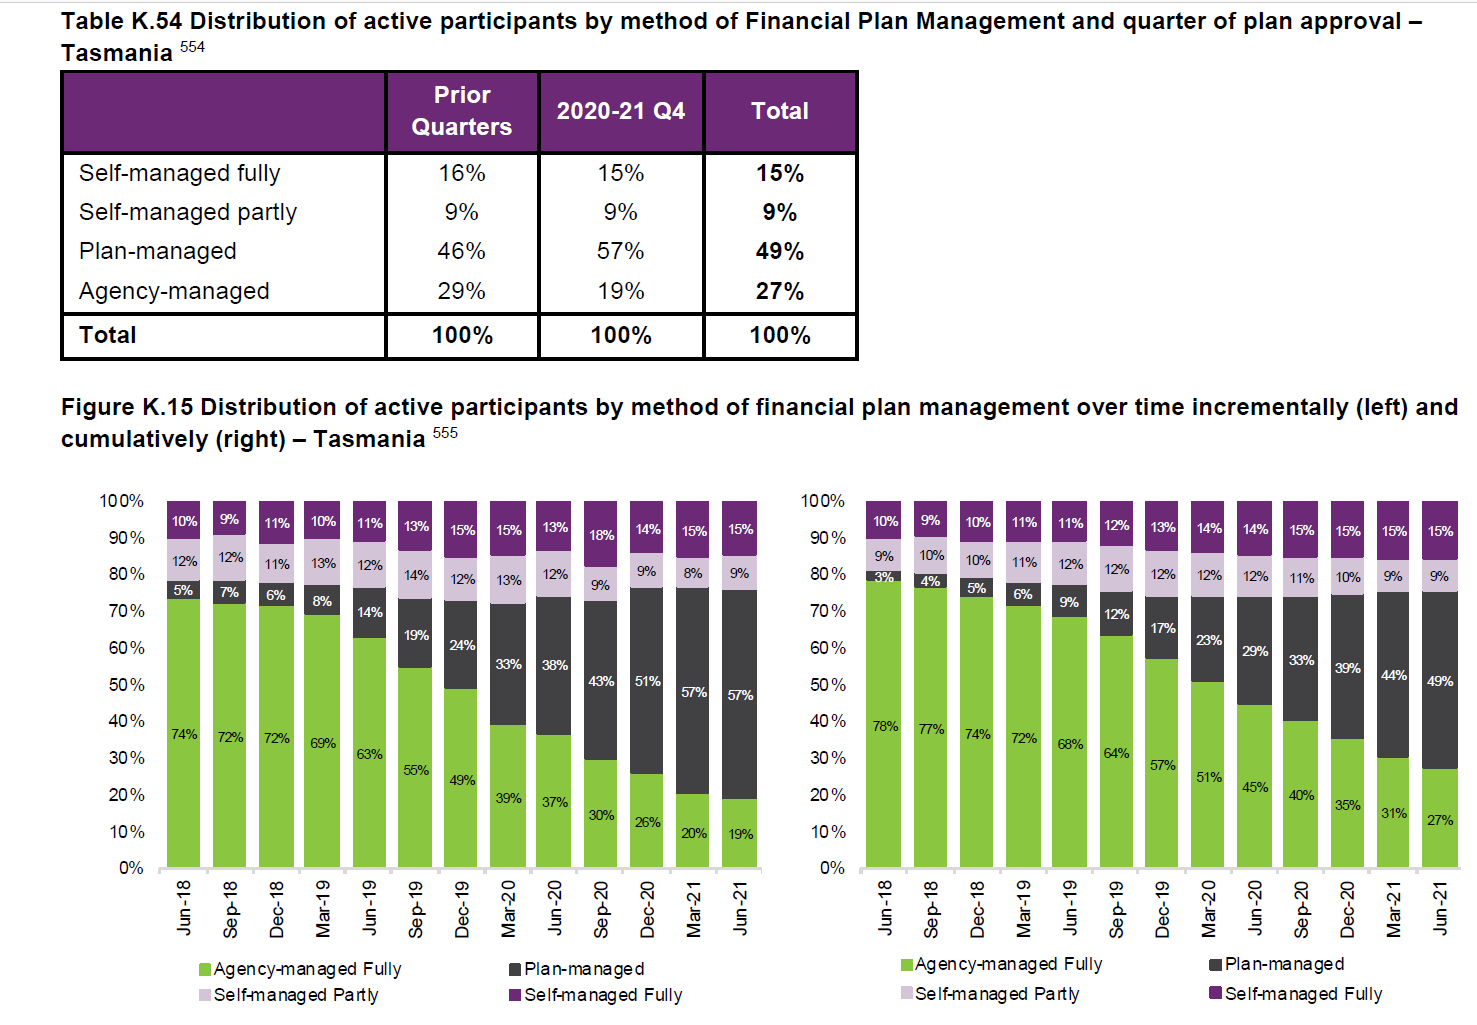
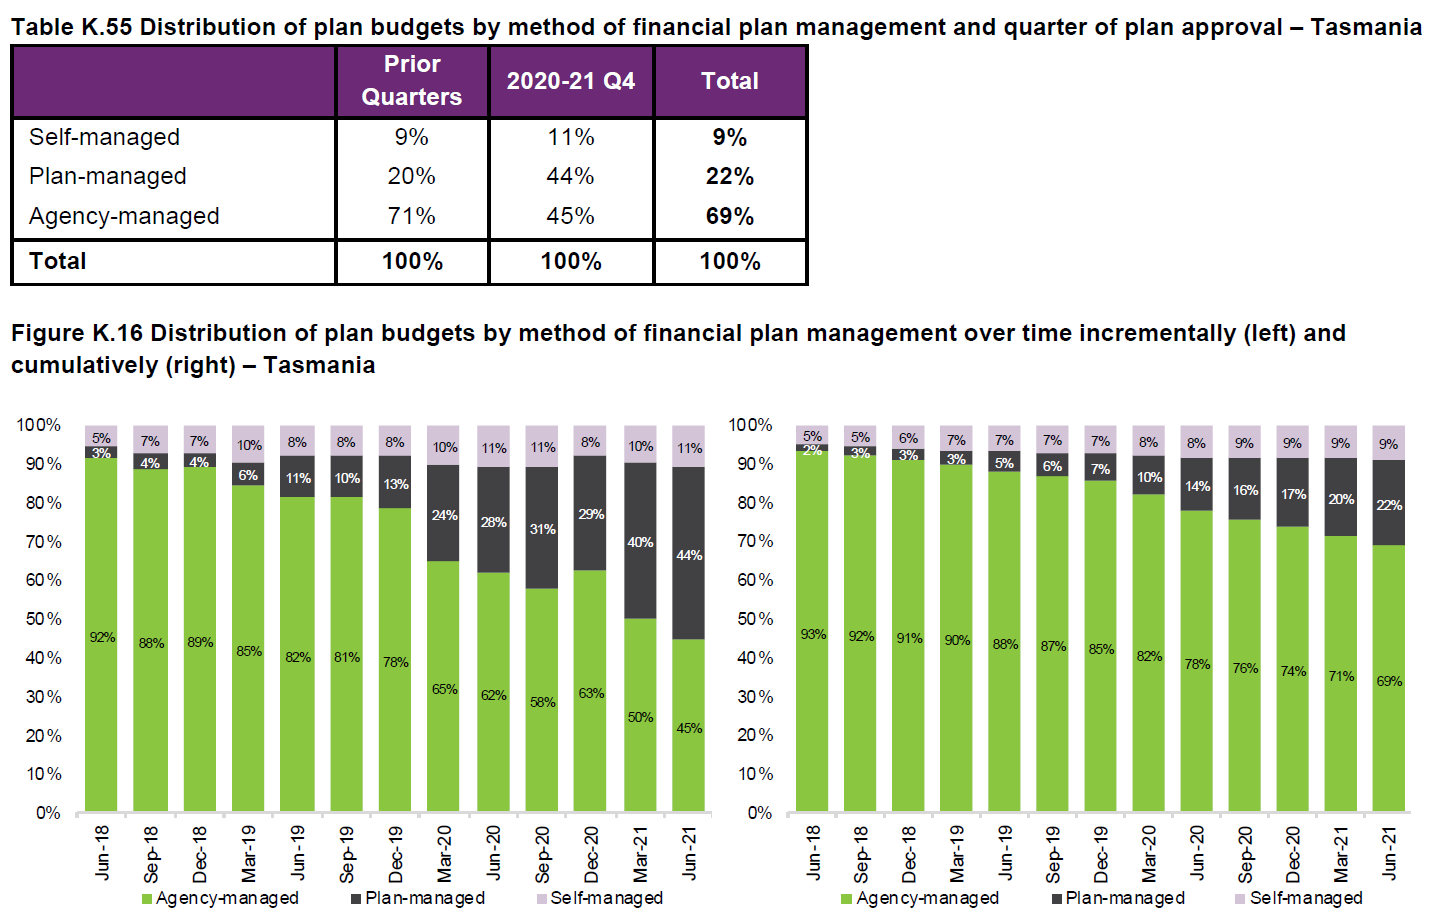
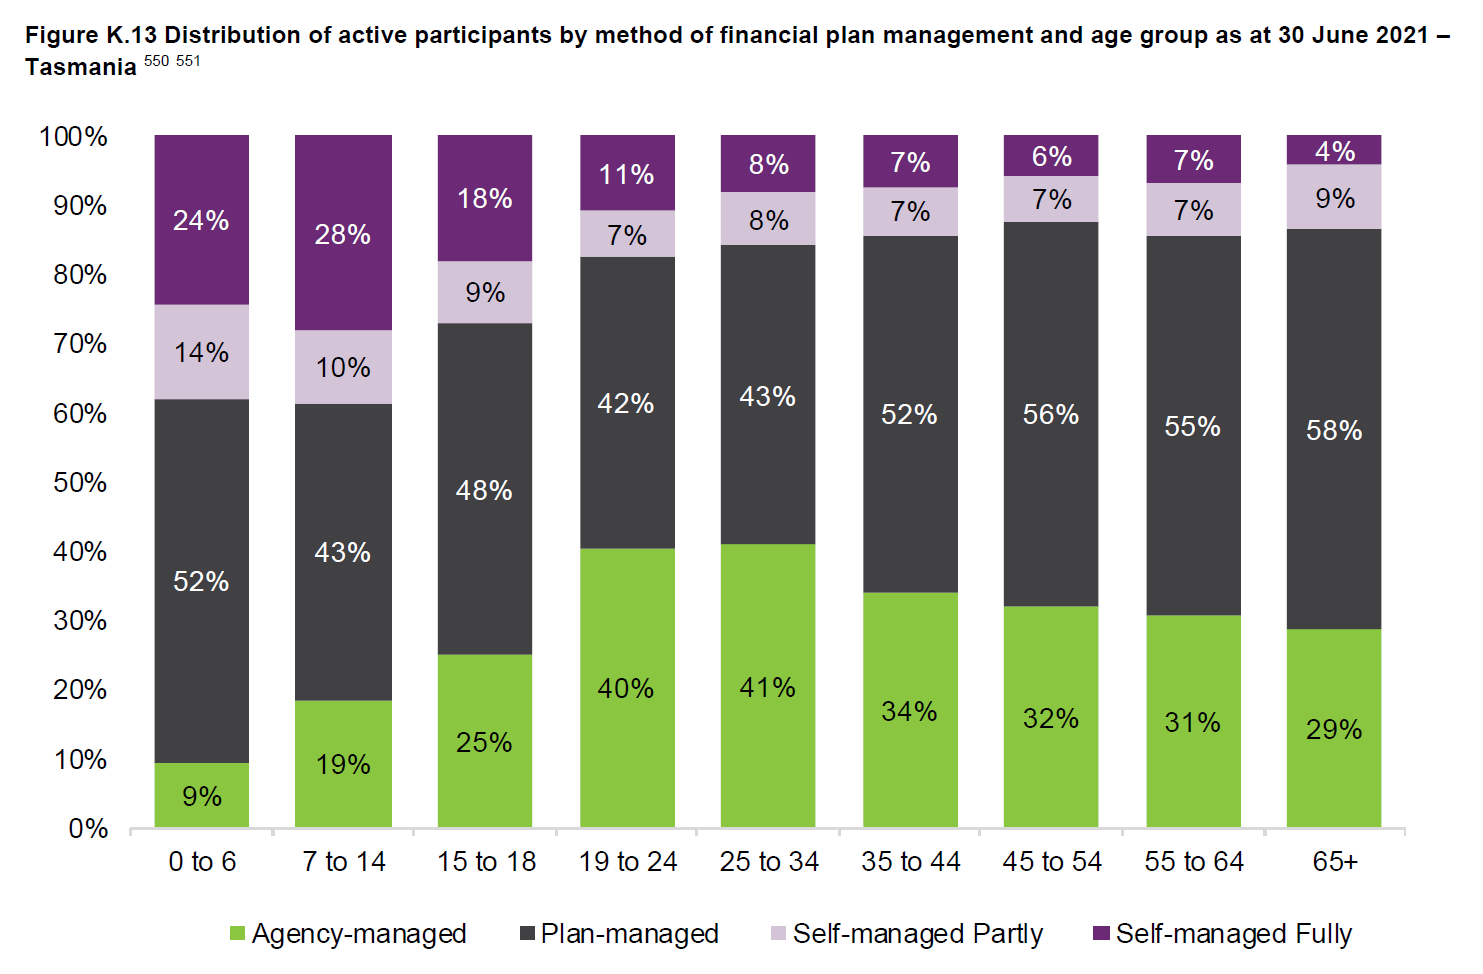
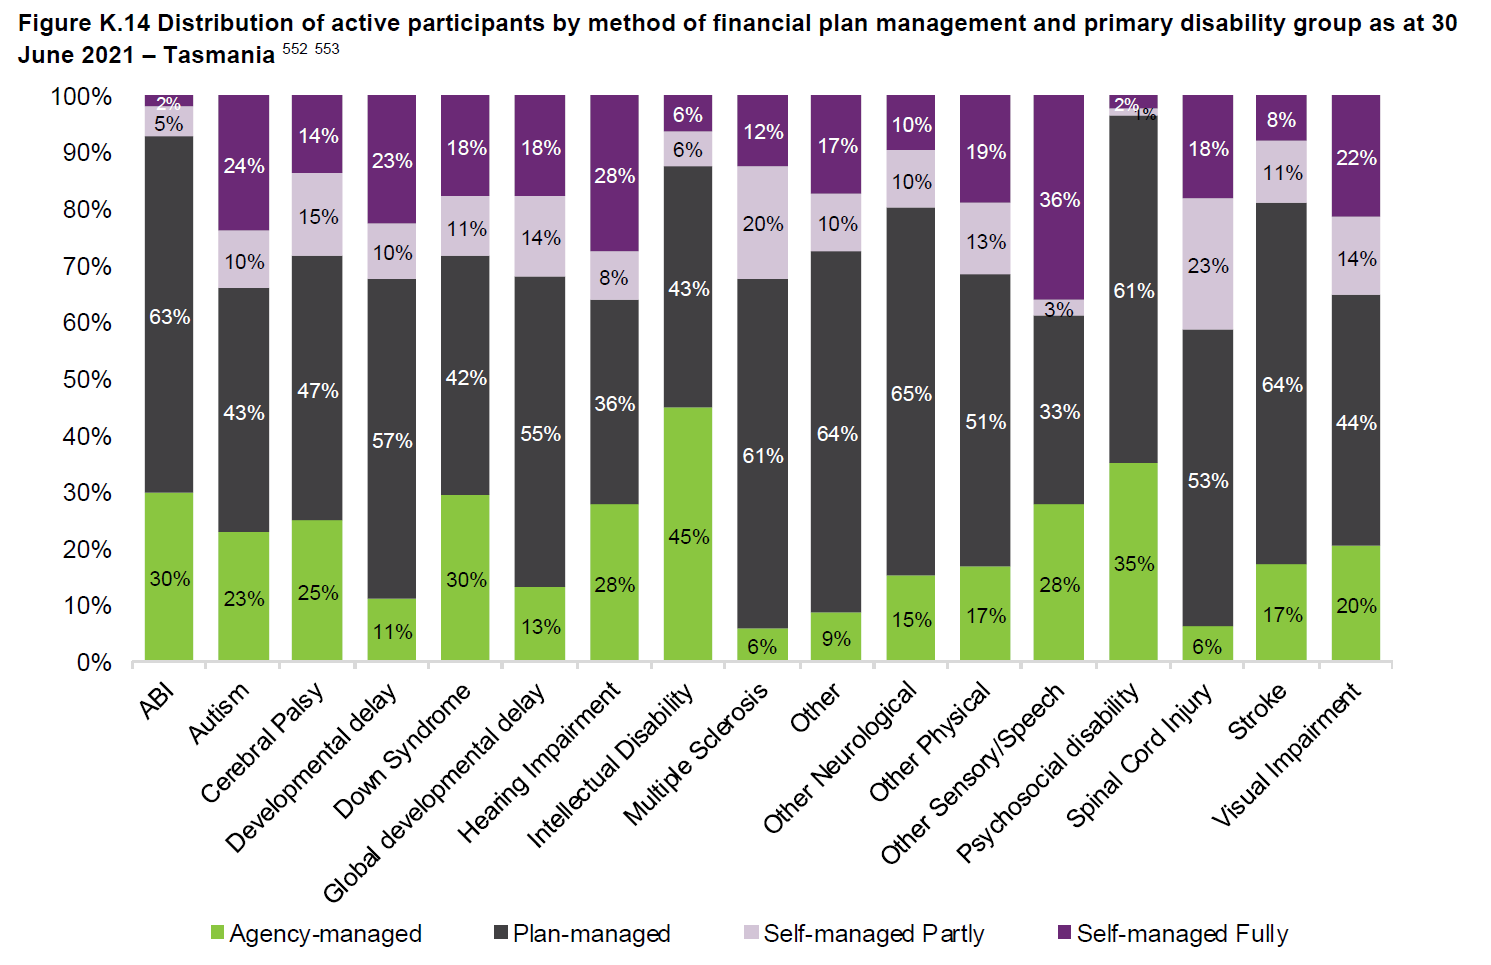
TASMANIA - PLAN MANAGEMENT
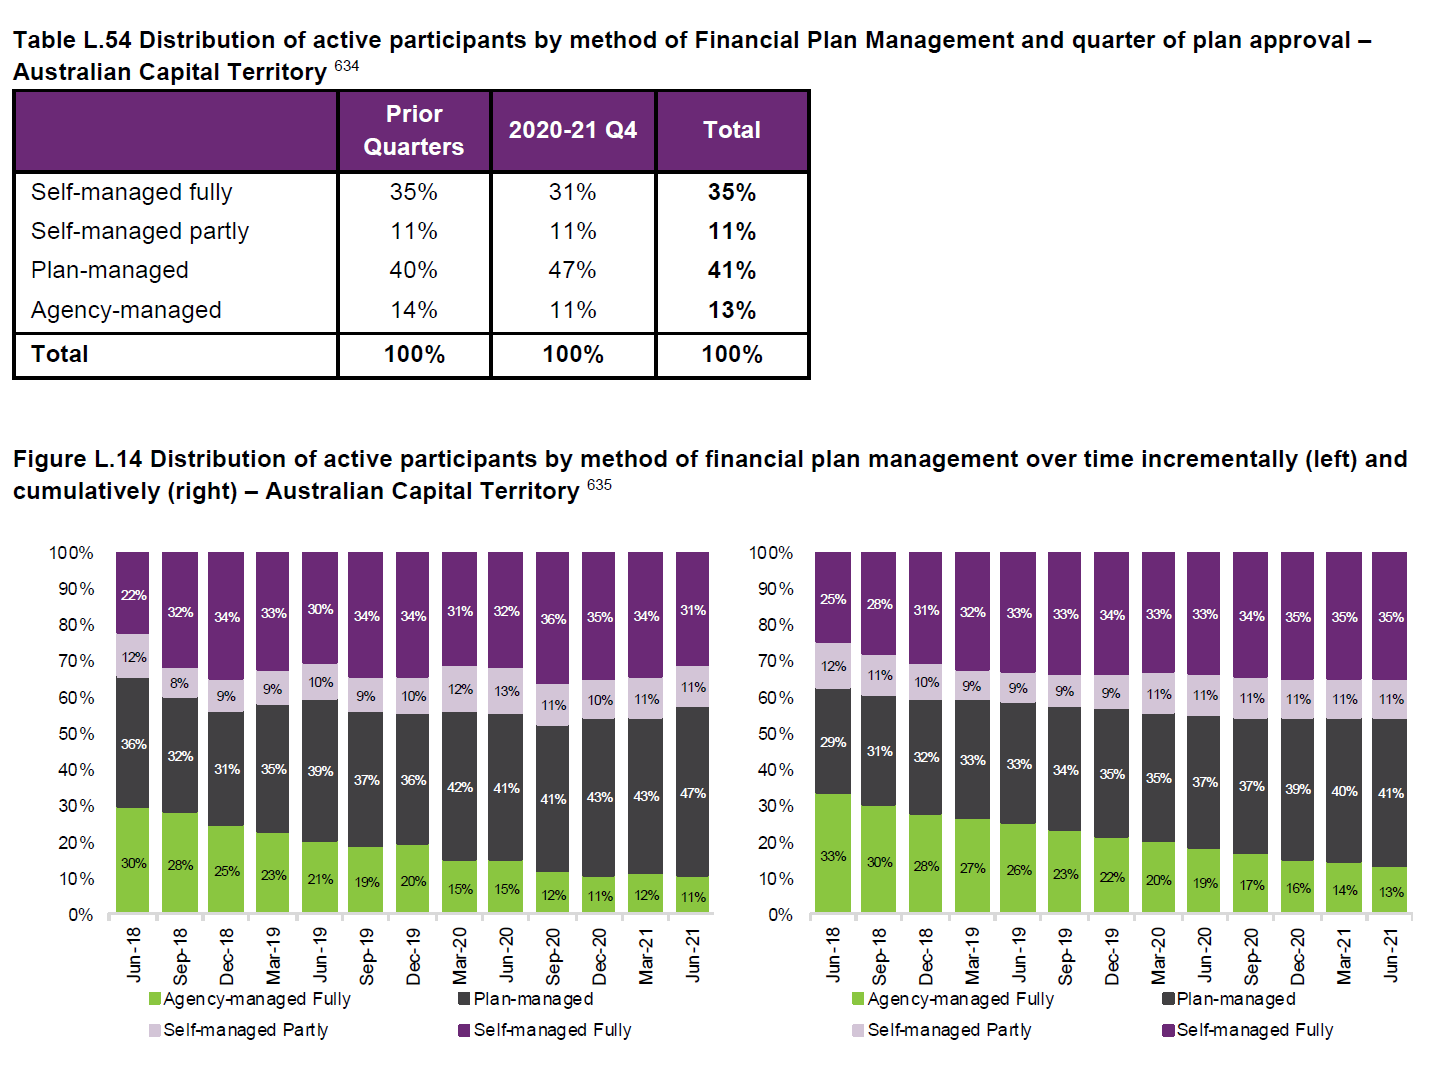
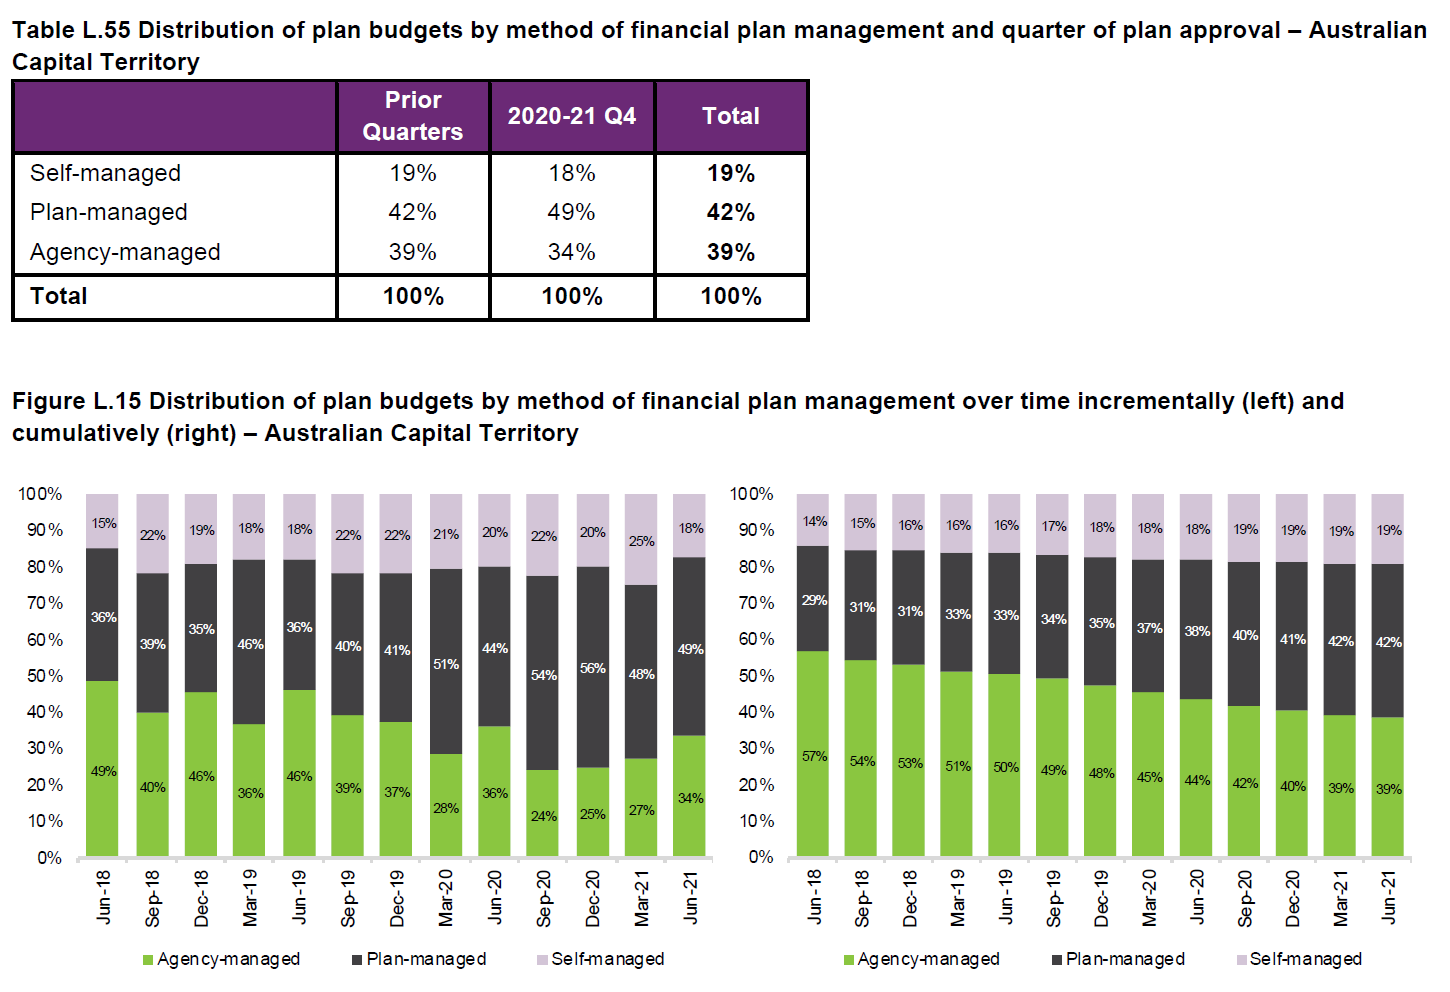
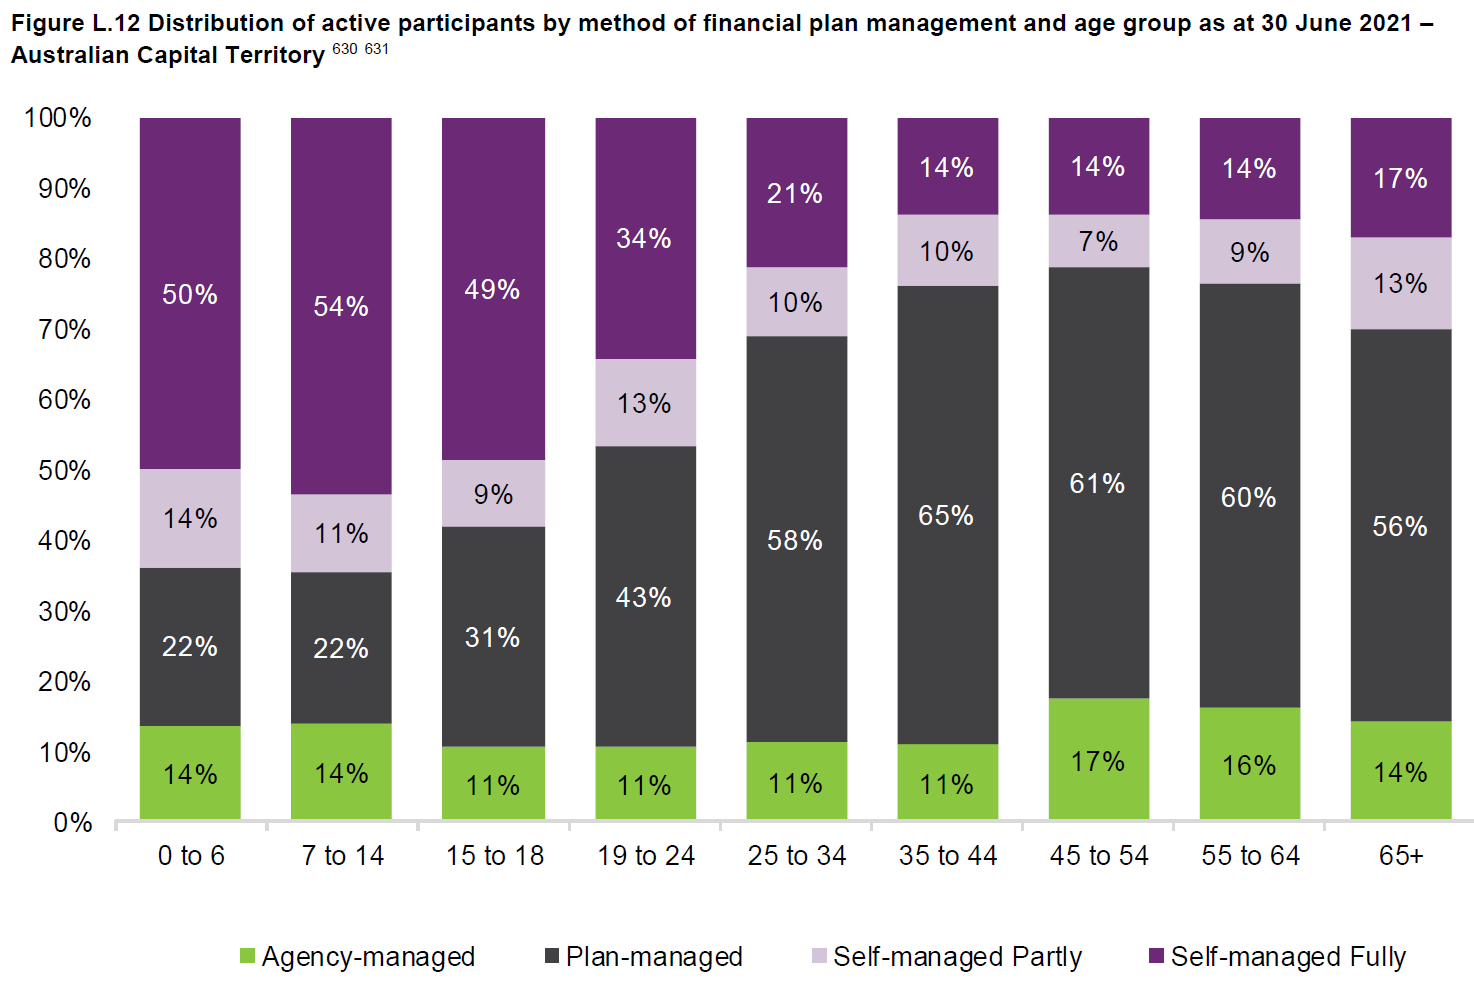
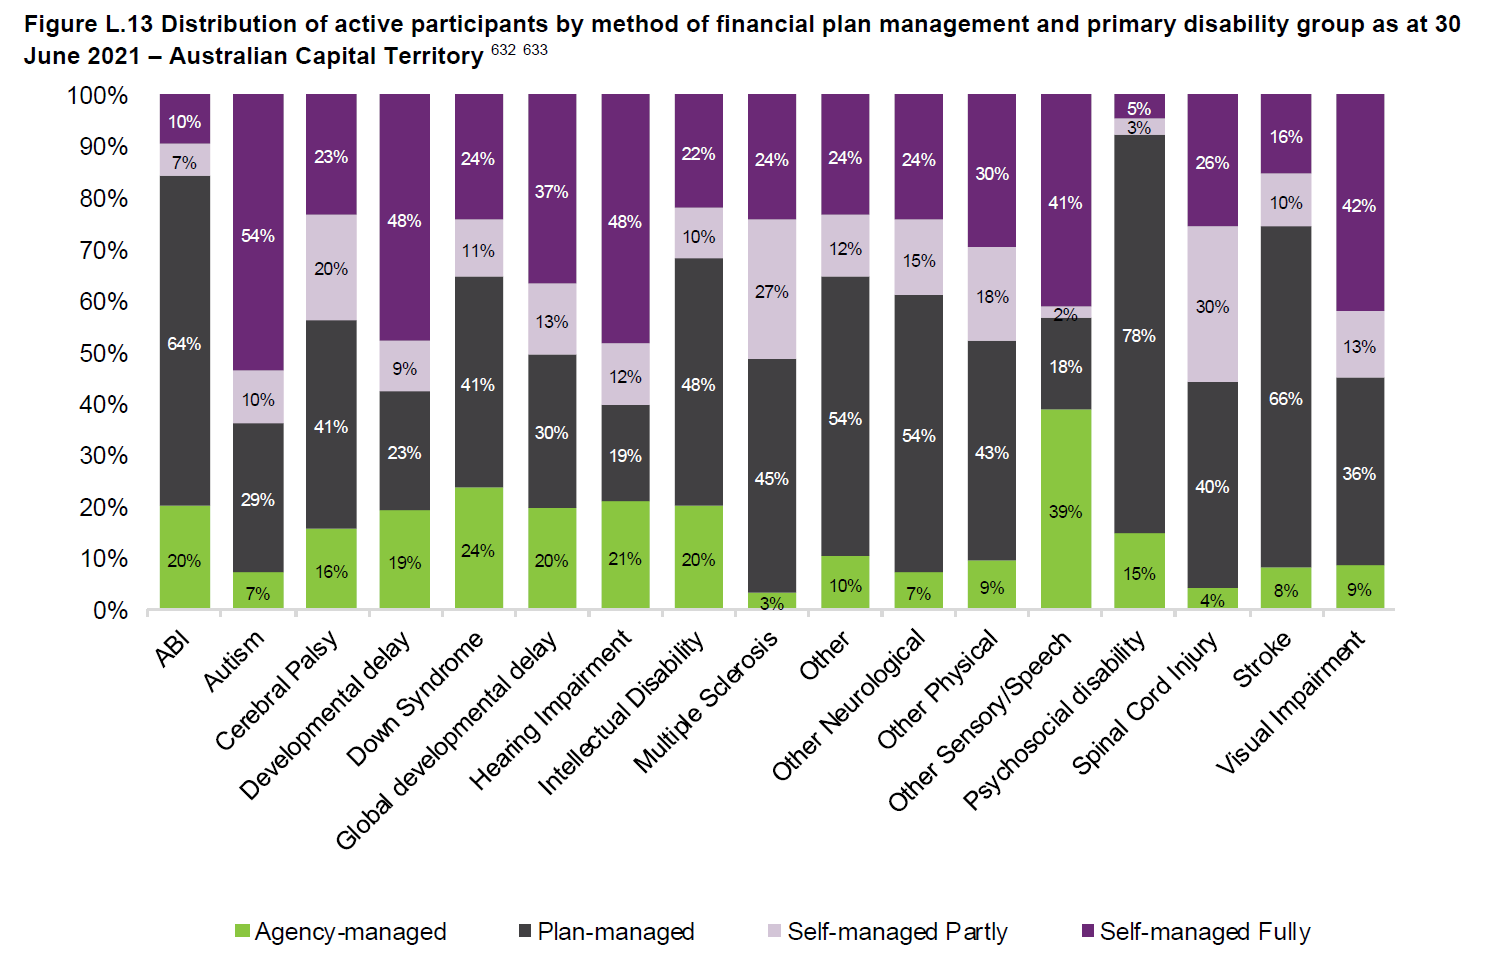
AUSTRALIAN CAPITAL TERRITORY - PLAN MANAGEMENT
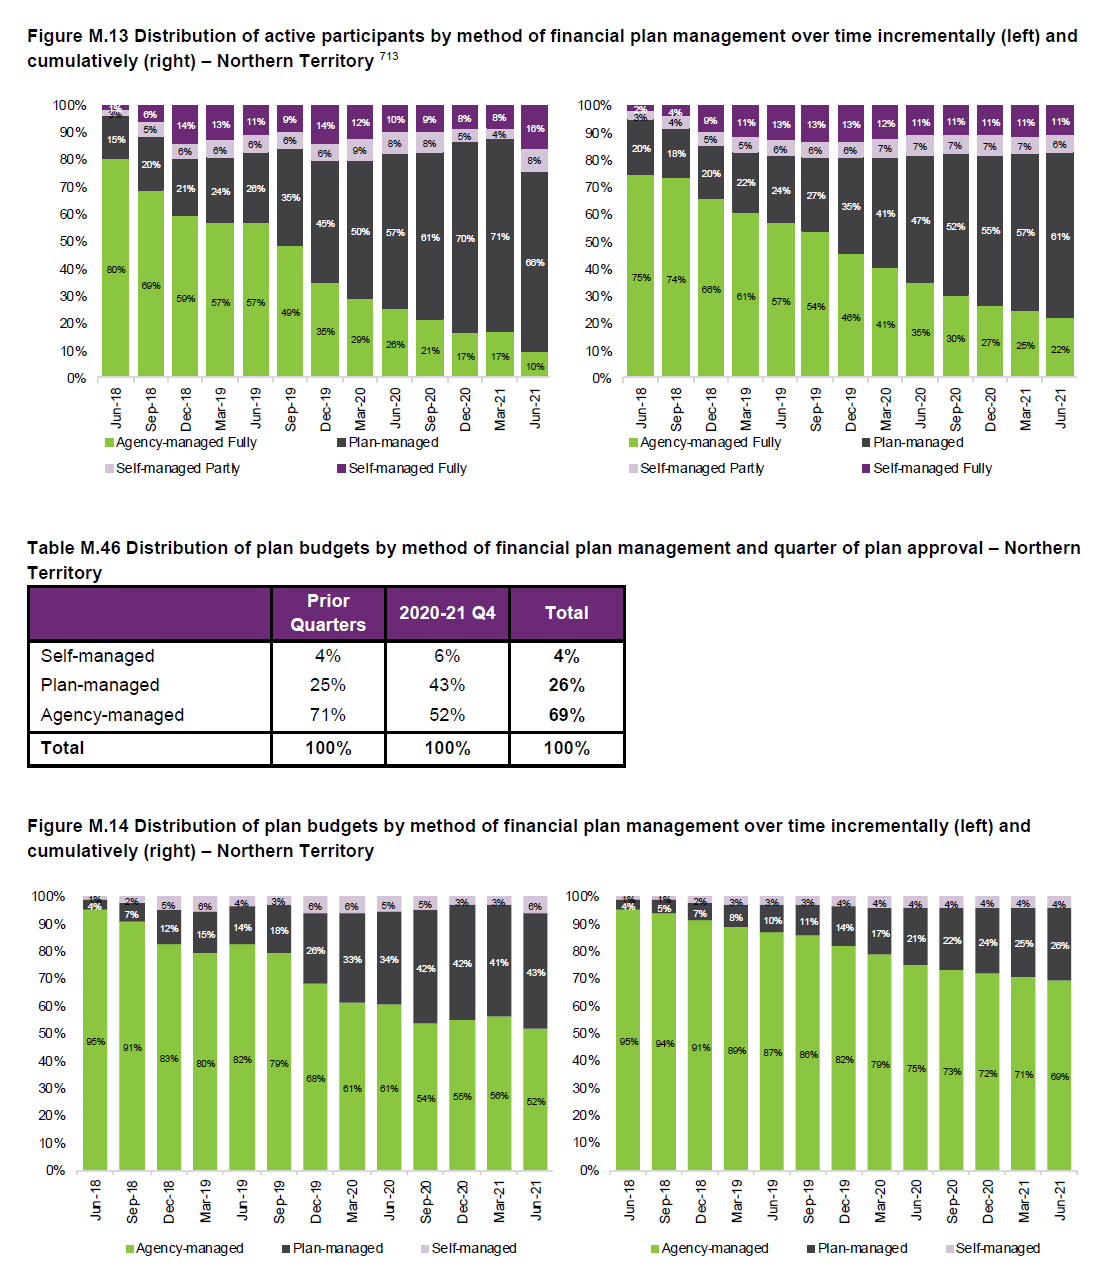
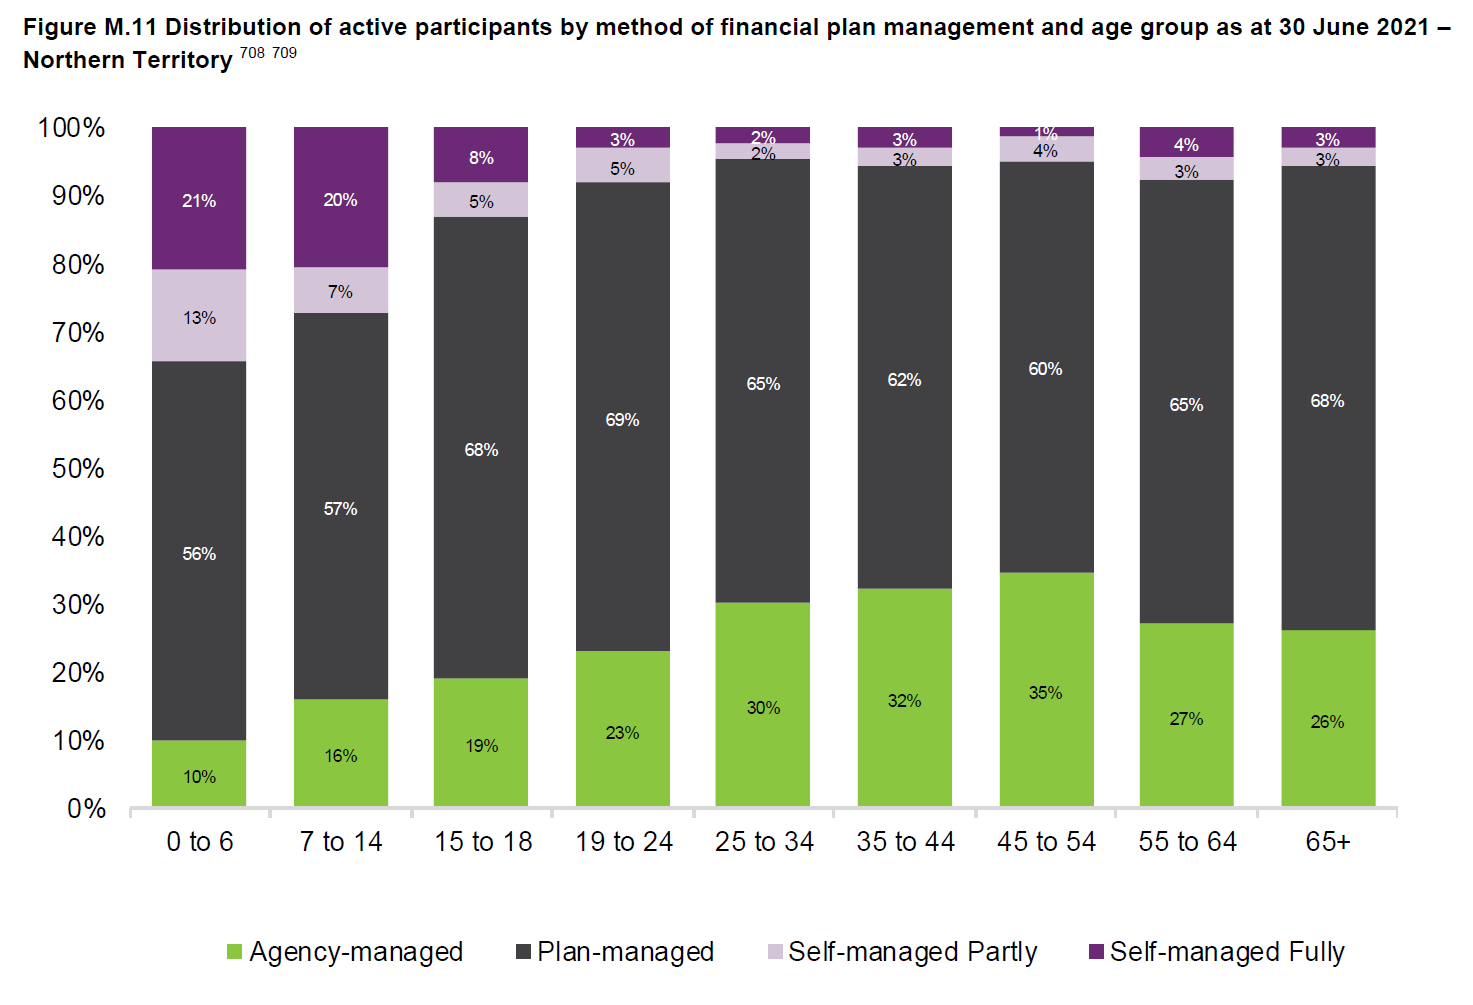
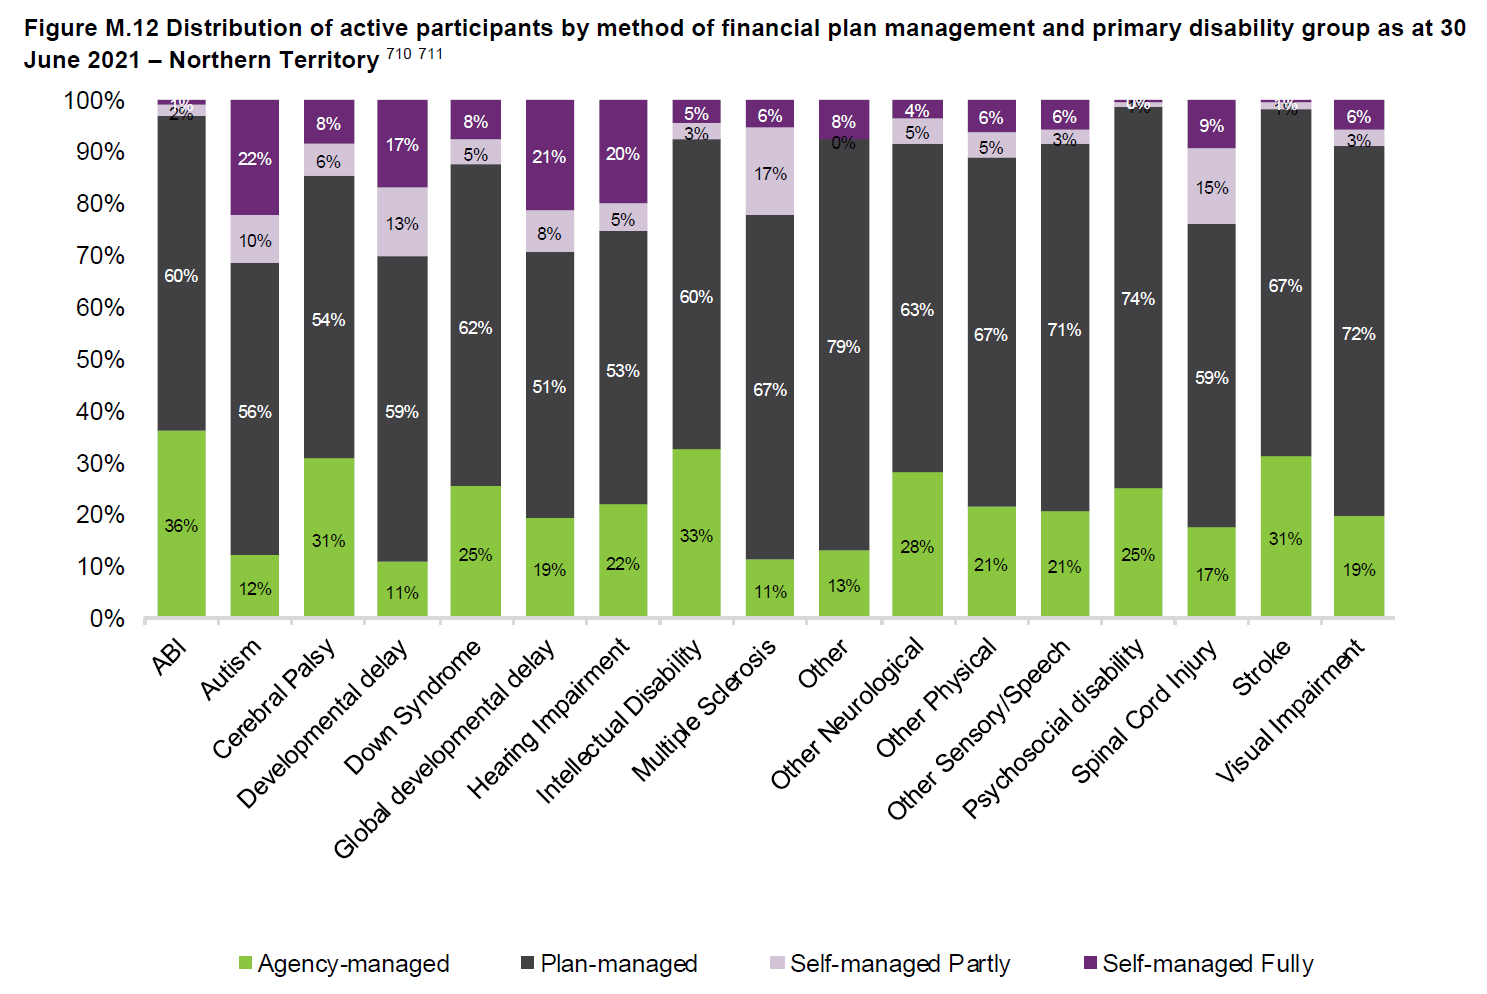
NORTHERN TERRITORY - PLAN MANAGEMENT

SUPPORT COORDINATION NATIONALLY
- 46% of plans last quarter included support coordination, an increase of 4% from previous quarters.
- Support coordination accounted for approximatly 3% of the total annualised committed support funding for 20/21.
- As DIA noted when reviewing the Q3 Report, the NDIA’s commitment to deliver clarity about support coordination and what participants should expect from them by the end of June 2021 has not been met. The Q4 report now has a timeline of September 2021 for this clarity around support coordination but DIA isn’t holding our collective breath.

NEW SOUTH WALES - SUPPORT COORDINATION

VICTORIA - SUPPORT COORDINATION

QUEENSLAND - SUPPORT COORDINATION

WESTERN AUSTRALIA - SUPPORT COORDINATION

SOUTH AUSTRALIA - SUPPORT COORDINATION

TASMANIA - SUPPORT COORDINATION

AUSTRALIAN CAPITAL TERRITORY - SUPPORT COORDINATION

NORTHERN TERRITORY - SUPPORT COORDINATION


