2021- 22 NDIS Q2 Report – Highlights
The Hon Linda Reynolds CSC released the NDIS Quarterly Report for disability ministers Q2 2021-2022 on 8th February. DIA has poured over the 2021-22 NDIS Q2 Report picking out the “highlights”. Spoiler Alert: After numerous quarters of chopping and changing the data reported the NDIA have, in the main, kept consistent with what was in the Q1 report.
The report is a summary of how the Scheme performed from 30 September 2021 to 31 December 2021.
Key Scheme Numbers Include:
- 502,413 people with a disability are being supported by the NDIS
- 20,384 people with a disability joined the scheme in Q2 (an increase of 4%)
- 38% of new participants in Q2 were aged 0-6 (7,832)
- Participation costs in Q2 was $6.7bln, up from $6.4bln in Q1.
The continuing value Intermediaries bring to both participants and the NDIS is clearly demonstrated by the increasing numbers of participants engaging Registered Plan Management and Support Coordination Providers across Australia.
On the data published by the NDIA, DIA’s CEO, Mr Jess Harper said:
“We welcome the release of the NDIS Q2 – Quarterly Report, the data in the report shows a continuing trend in participants requesting all or part of their funds to be managed by a Registered Plan Management Provider. The ongoing increase in the number of participants being funded with Support Coordination within their plan is also encouraging. We would again call for a measure of adequacy to be included in the data”.
OVERVIEW
The Q2 2021 – 2022 quarterly report is, like its previous editions, an eye wateringly long document at 661 pages if you are, like DIA, interested in reading through the many pages of Appendices. Essentially this Report takes the same format as the Q1 2021-2022 and is therefore an update of “more of the same” rather than providing any new or valuable information. As noted in the Q1 2021-2022 report, the NDIA made some significant changes from the Q4 2020- 2021 report following repeated questioning of the information presented. As a reminder DIA noted that:
- The much discussed “Functionality” measures have been left out;
- Graph highlighting participants issues with “Choice and Control” has also been left out.
These have not re-appeared in the Q2 2021-2022 report.
The narrative of engagement and working with the disability community from the NDIA is evident in the report which considering the way the proposed legislative changes and aspects of the COVID-19 response were handled well into 2022 could be brought into question.
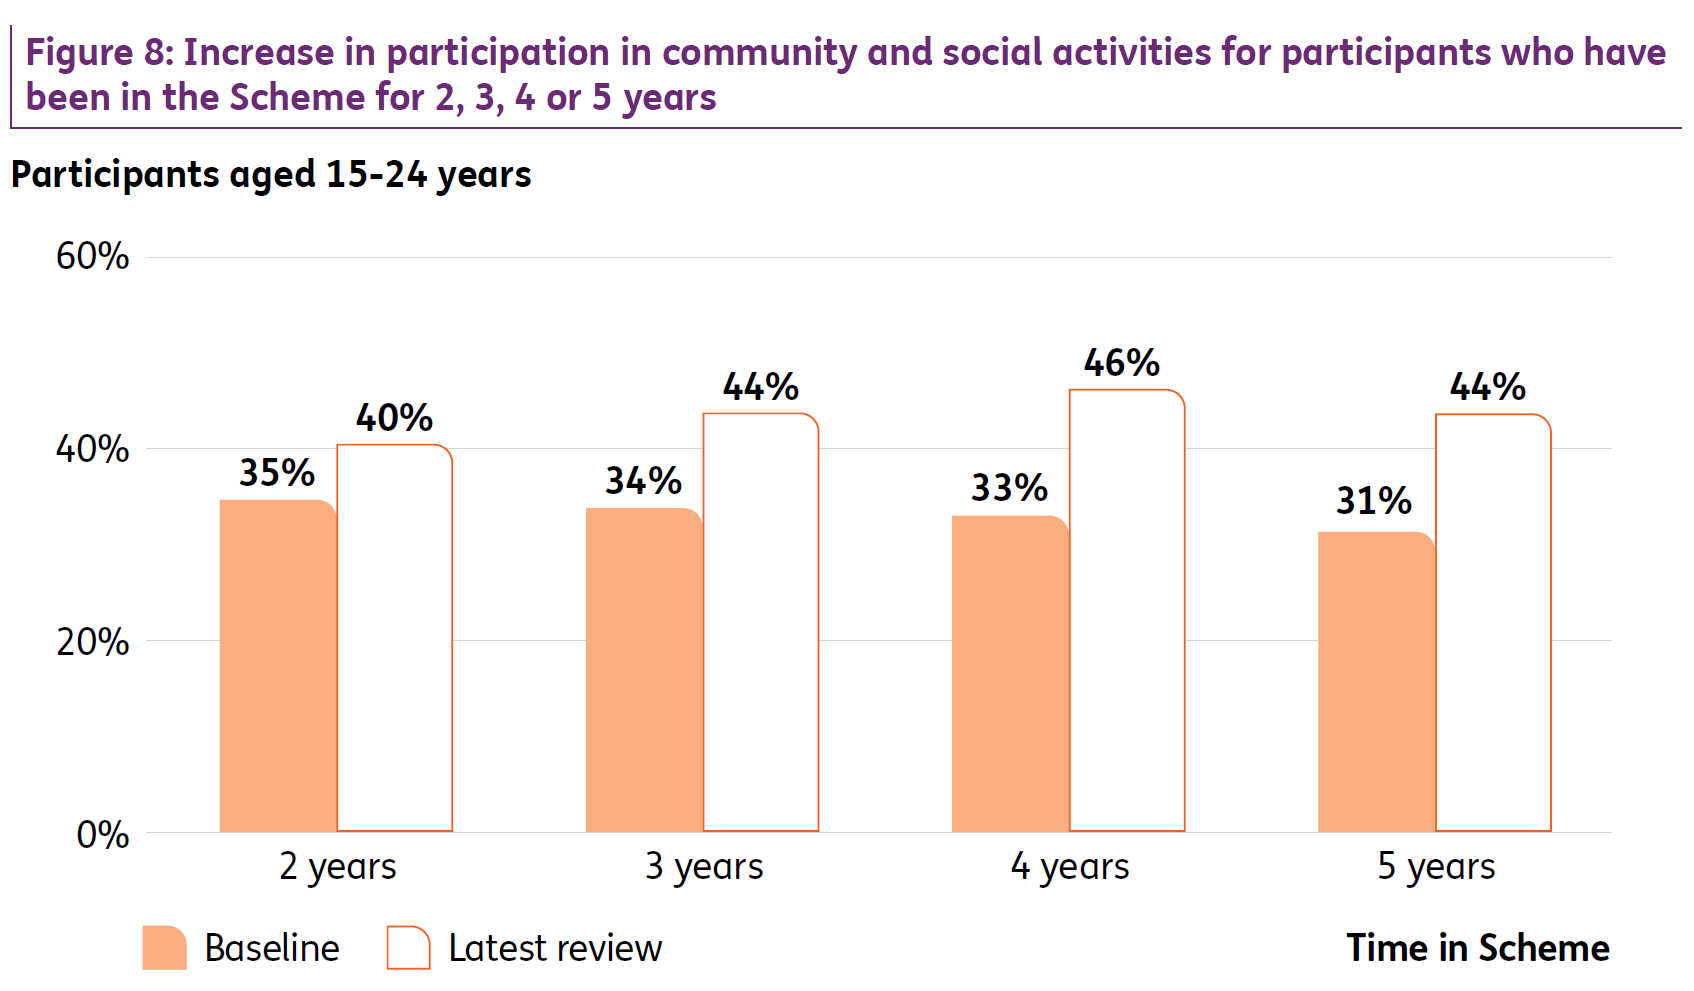
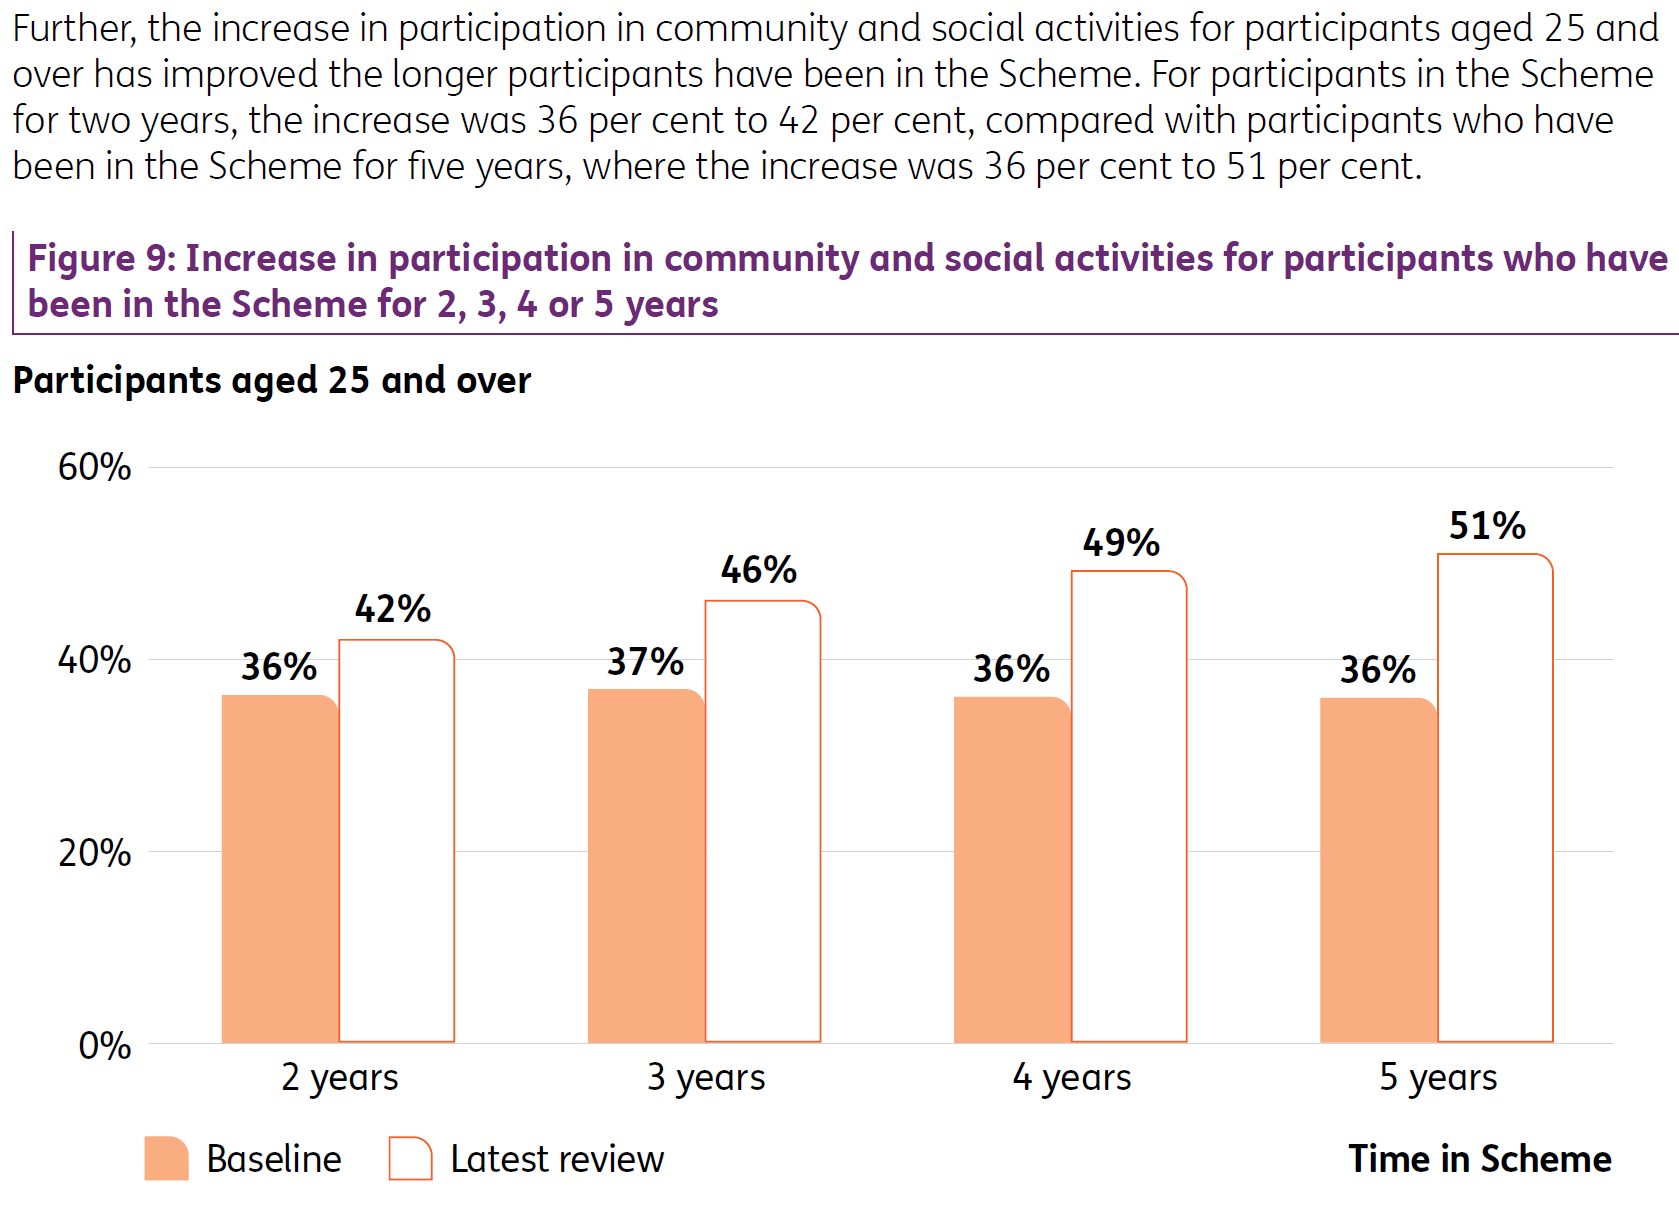
Functionality Remains Out – Community and Social Activities In
As highlighted in DIA’s review of the 2020-2021 Q4 Report, the reporting from the NDIA showing apparent declines in participant functionality as participants spent time in the Scheme showed either;
- A Scheme that was failing its participants;
- A Scheme that promoted participants to “under report” functionality improvements; or
- Inaccurate data via collection or interpretation.
DIA would expect that the exclusion of this reporting set in the past two quarterly reports isn’t the NDIA putting “functionality” in the too hard basket, rather taking the time to assess and more accurately report the level of functional improvement being experienced by participants.
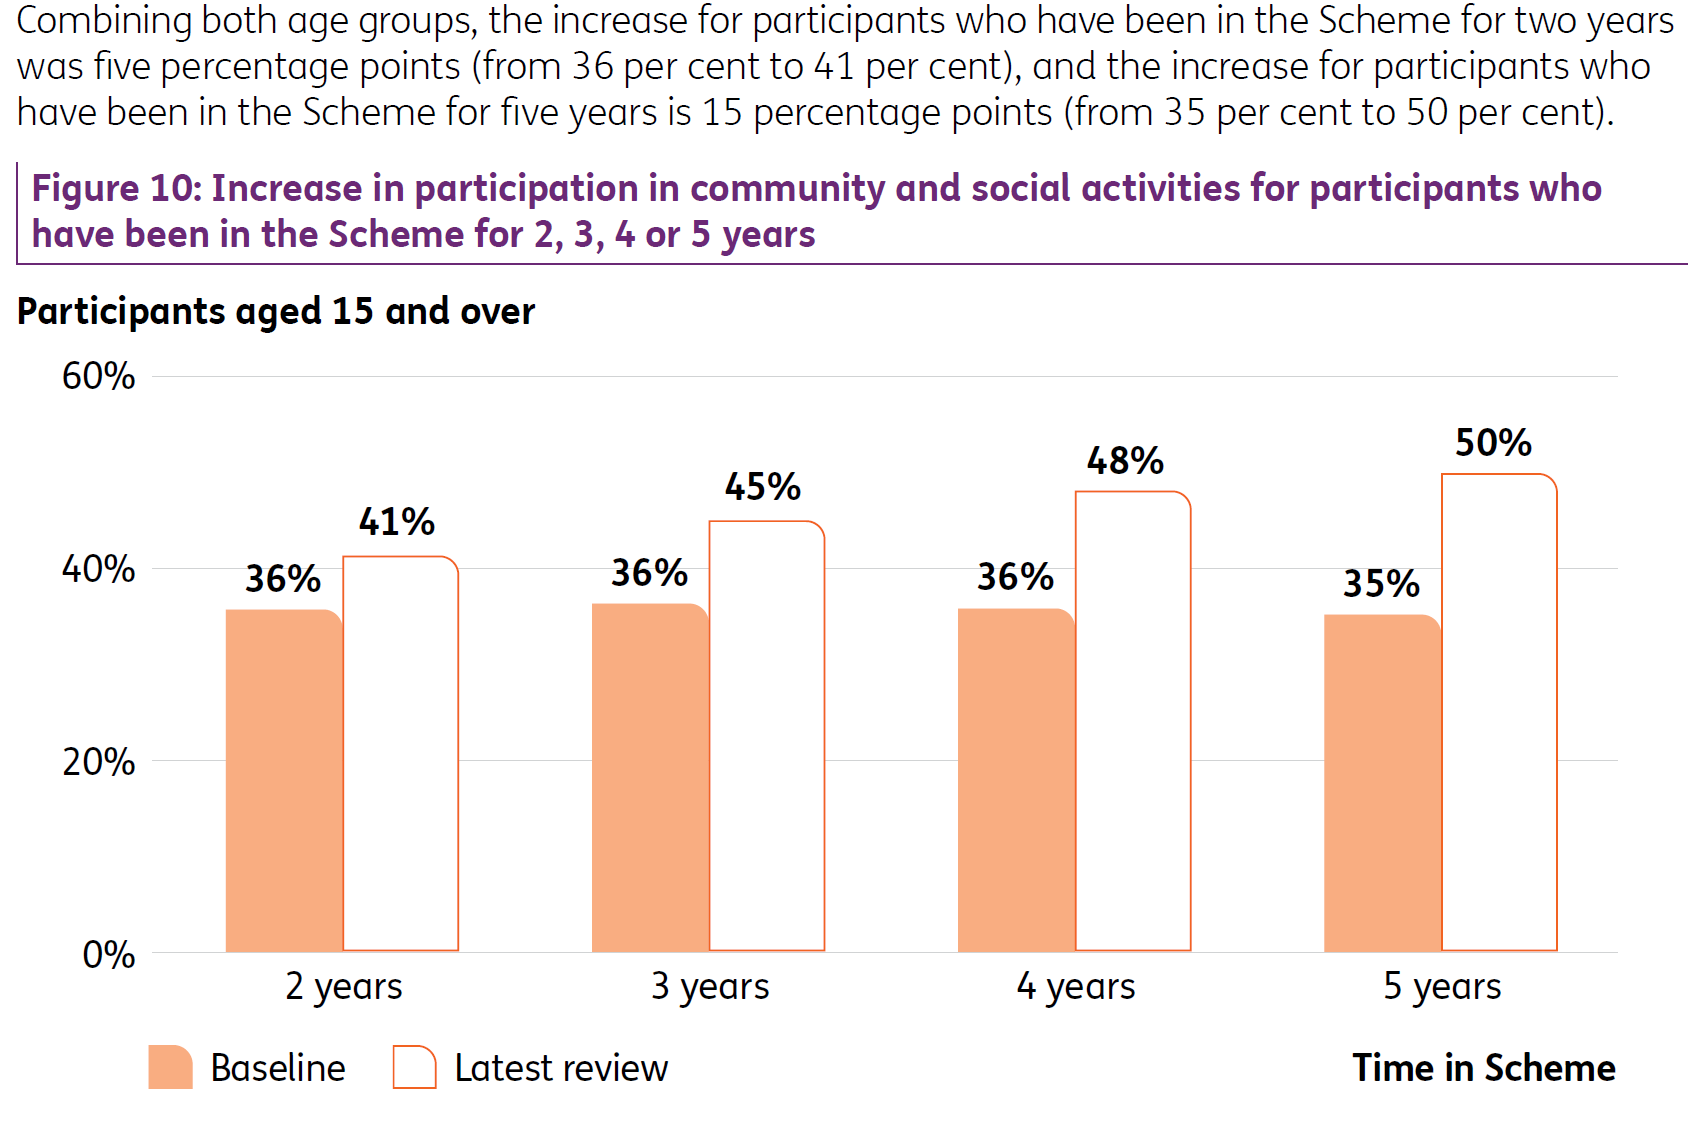
The NDIA have again provided a series of graphs highlighting the increased participation in community and social activities over a 5 year period which on face value we will take as a positive (noting our comments above of course).
Improved Employment Strategies Need to be Implemented
In 2019 the NDIA released its Participant Employment Strategy that sets out the commitment and strategy from the NDIA to participants in finding and keeping meaningful employment. Subsequently, the NDIA have released two research papers on employment; Employment Outcomes and Exploring Participant Experiences which have been used to formulate the NDIA’s Participant Employment Strategy 2021-22 Action Plan that aims to have 30% of employment age participants in meaningful work by June 2023. The NDIA notes that the current environment continues to be challenging but this important commitment needs to be a high priority for the NDIA given the significant benefits employment generates for participants and secondly, the often neglected benefits that the Scheme generates for society and the economy as a whole.
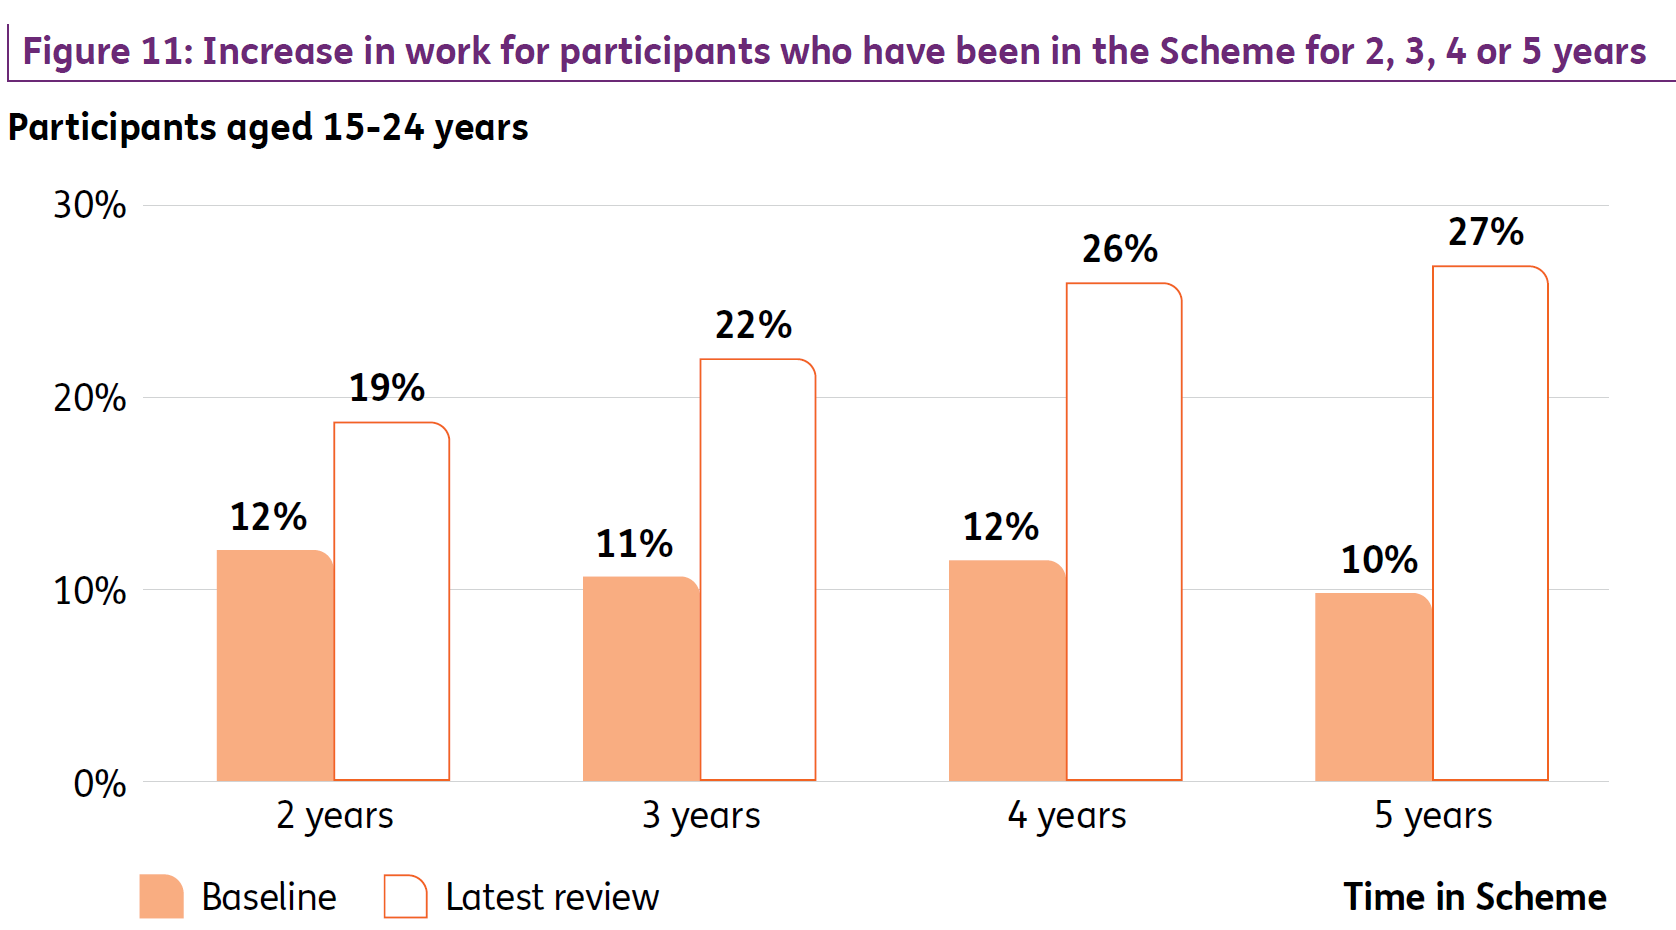
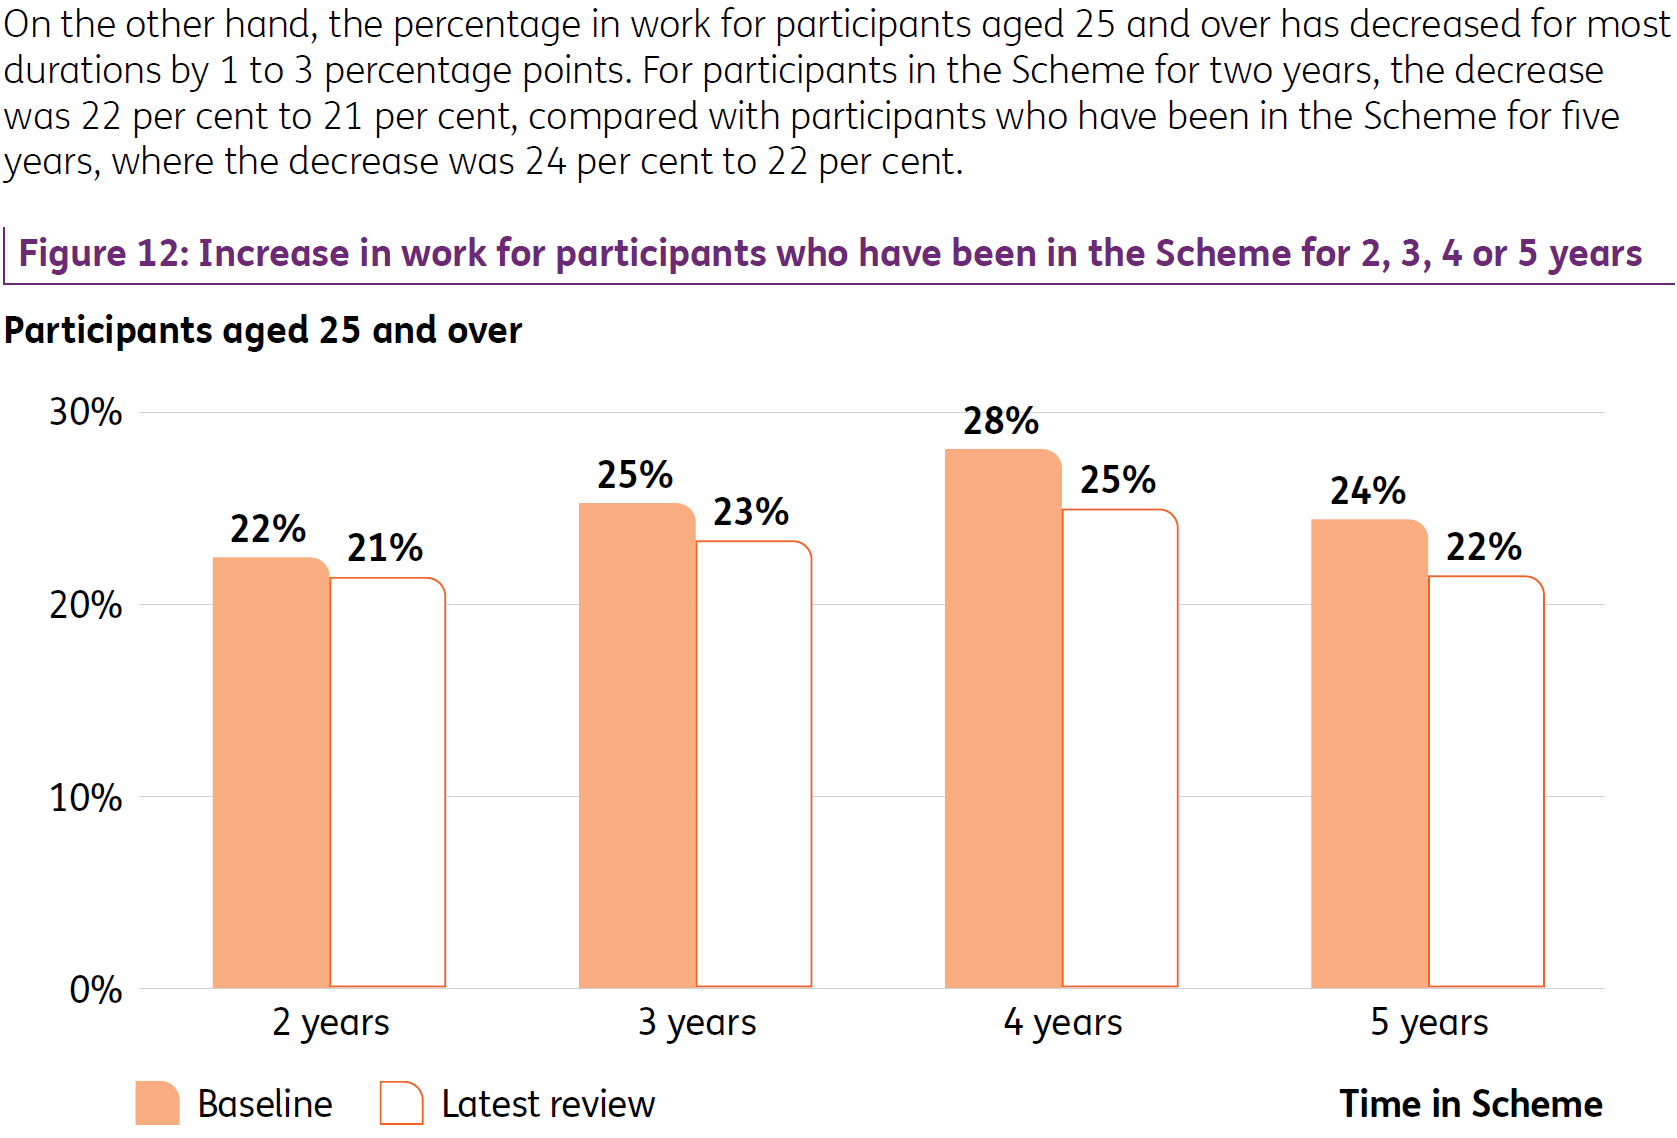
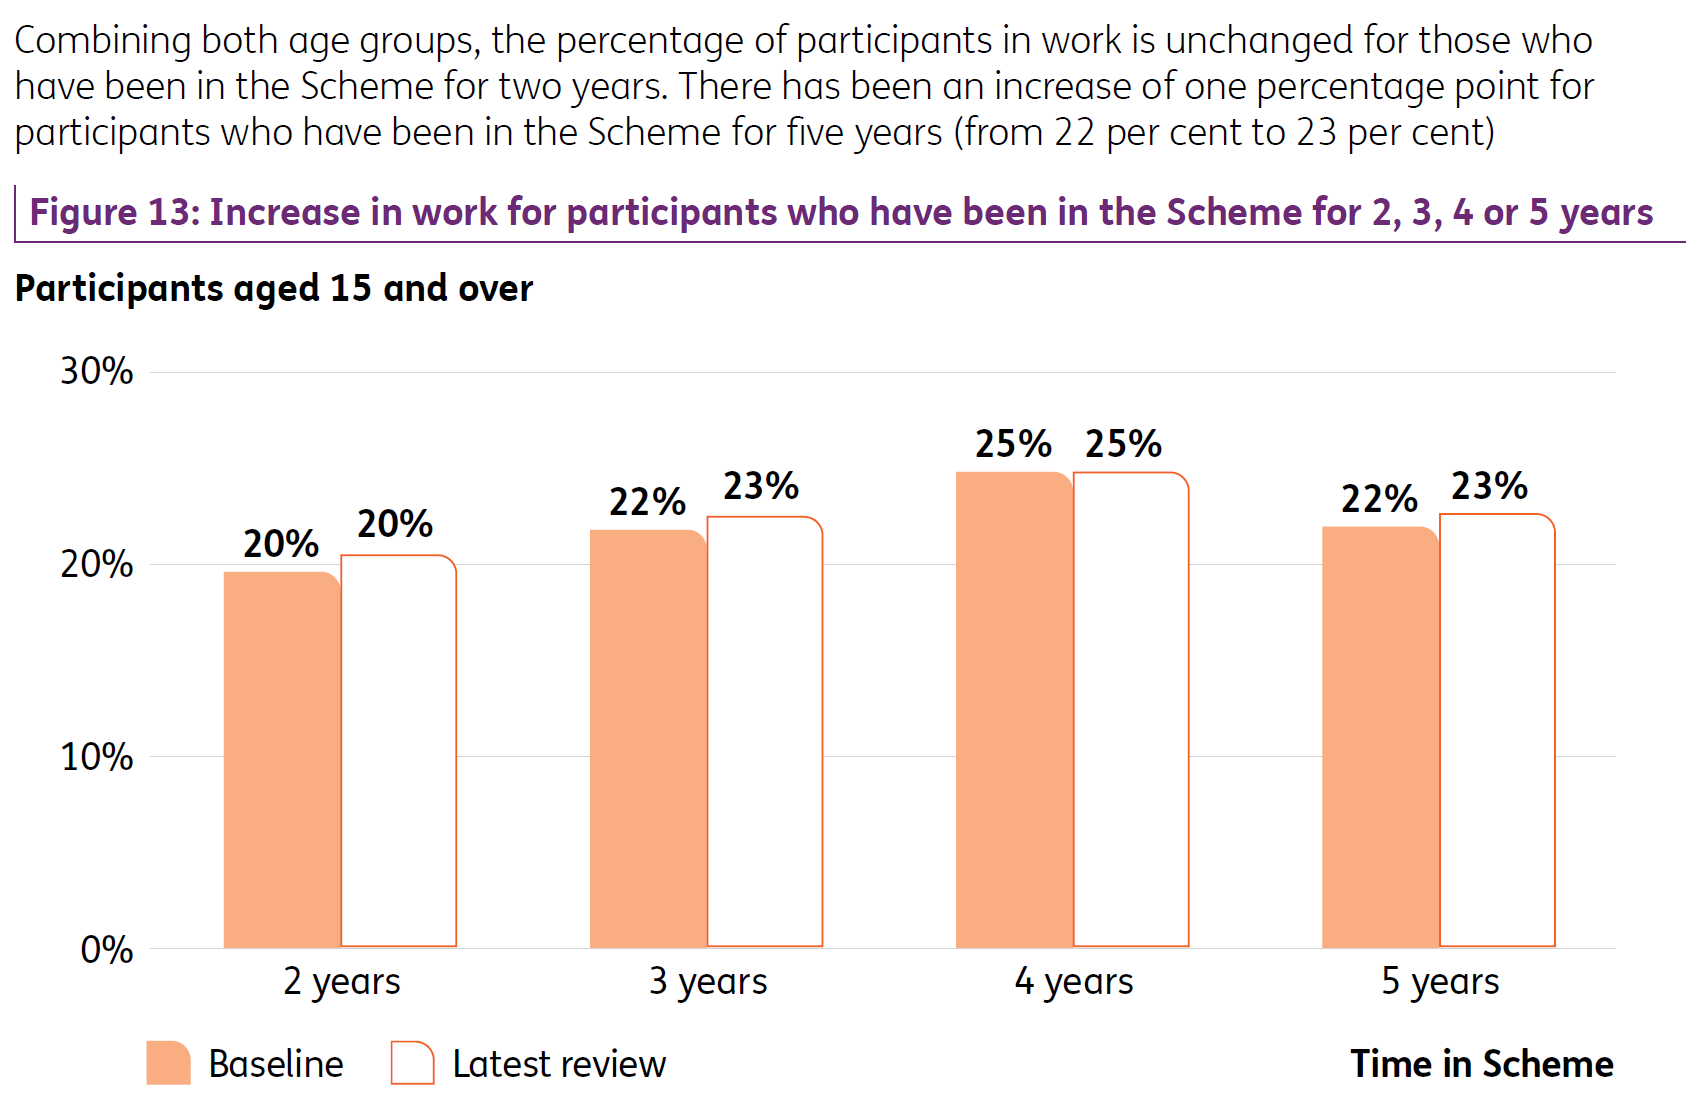
As shown below, when both age cohorts are combined there is significant improvement required in order for the 30% target to be met by 2023.
The SIP Continues to Slip….
Following the Tune Review, the NDIA implemented the Participant Service Guarantee (PSG) and the Participant Service Improvement Plan (SIP). The NDIA have been reporting on the progress of the SIP and over the past 18 months there have been a number of extended time frames noticed by DIA. Below is a snapshot of the delays from the original published completion date, the completion date in the 2020-21 Q4 report, the completion date published in the 2021-2022 Q1 report and the updated completion dates published in the 2021-21 Q2 report:
SIP – Face-to-face meeting with the person making decisions on plans and funding.
June 2021 to December 2021 to June 22 to June 2023 (24 months behind).
SIP – Manage your plan via a new NDIA mobile app.
June 2021 to December 2021 to June 2022 to March 2022 (6 Months Behind).
SIP – The website and portal will be clearer and easier to use.
December 2021 to December 2021 to September 2023 to September 2022 (6 Months Behind).
SIP – Promote children and young people’s voice in their own plans.
June 2021 to December 2022 to June 2022 still June 2022 (12 Months Behind).
SIP – Apply to the NDIS in your way including an online access form.
December 2021 to December 2022 to June 2022 to June 2023 (18 Months Behind).
SIP – Support more video-conference plan meetings.
June 2021 to December 2021 to March 2023 to September 2022 (15 Months Behind).
SIP – Clearer about Support Coordination services and what to expect from them.
June 2021 to September 2021 to June 2022 still June 2022 (12 Months Behind)
DIA has previously noted the release of a report on the Support Coordination Discussion Paper and updated website content, however as we explained in our article DIA’s Summary of NDIA Support Coordination Discussion Paper there is a significant amount of work that remains outstanding.
SIP – We will have clearer guidelines and procedures so there is consistency in how we make decision and we will make more of these public.
December 2021 to December 2021 to June 2022 still June 2022 (6 months behind).
SIP – We will improve the way we provide you support for independent decision-making.
June 2022 to June 2022 to December 2023 to December 2022 (6 months behind).
SIP – Our guidelines will come in plain English descriptions and more examples.
December 2021 to December 2021 to June 2022 still June 2022 (6 months behind).
SIP – We will be clearer on what reasonable and necessary supports means, with case studies and examples.
December 2021 to December 2021 to March 2022 to March 2022 (6 months behind).
DIA will continue to monitor the progress of the deliverables of the SIP with many due for completion between during the first half of 2022.
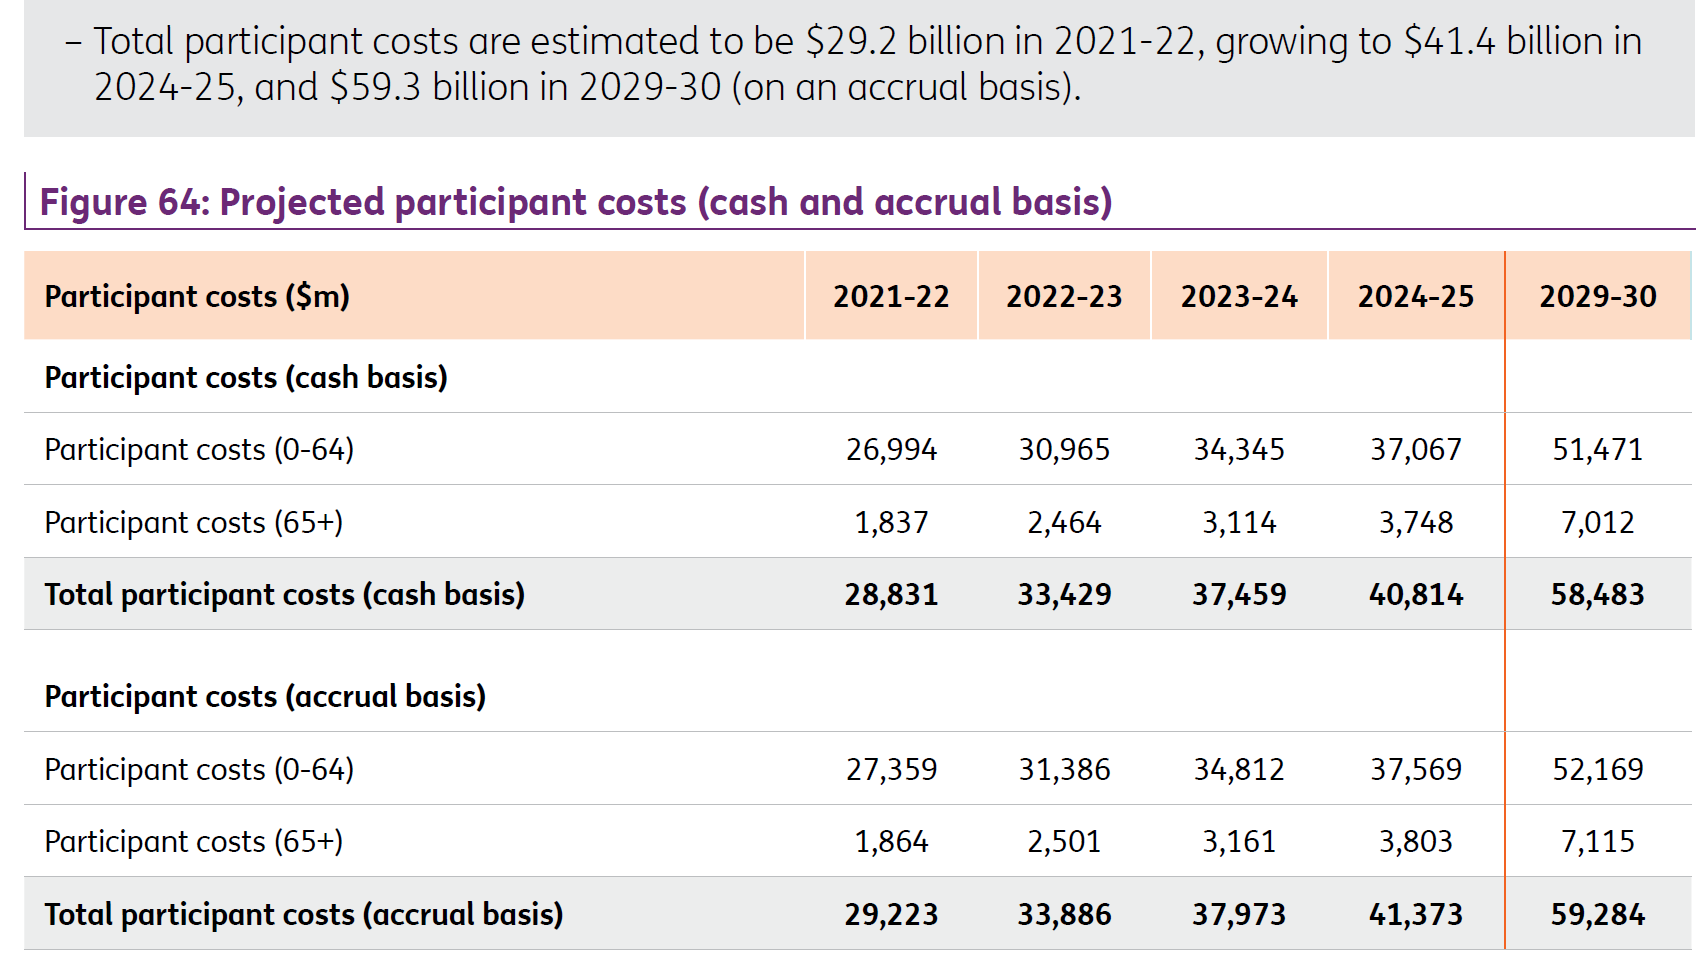
Section 5 Financial Sustainability
Once again the projections included in the quarterly report are one dimensional with no clarification of any underlying assumptions.
DIA would again call for a more transparent multi scenario forecast path to be presented rather than the repetition of the “one scenario” forecasting of the future costs of the Scheme:
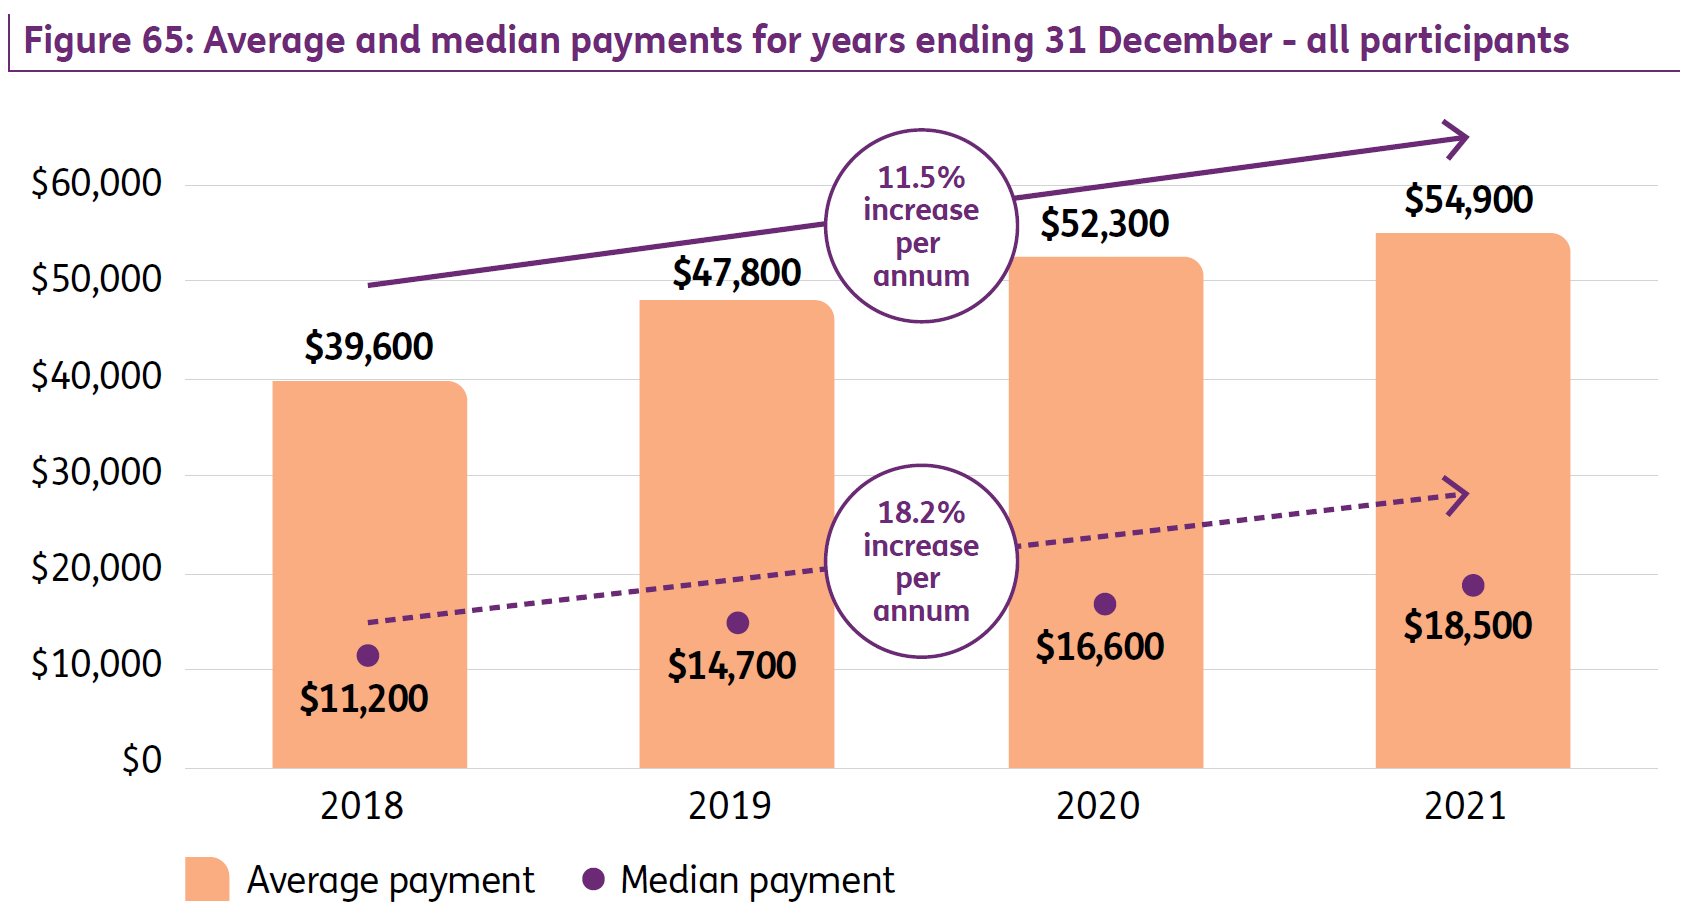
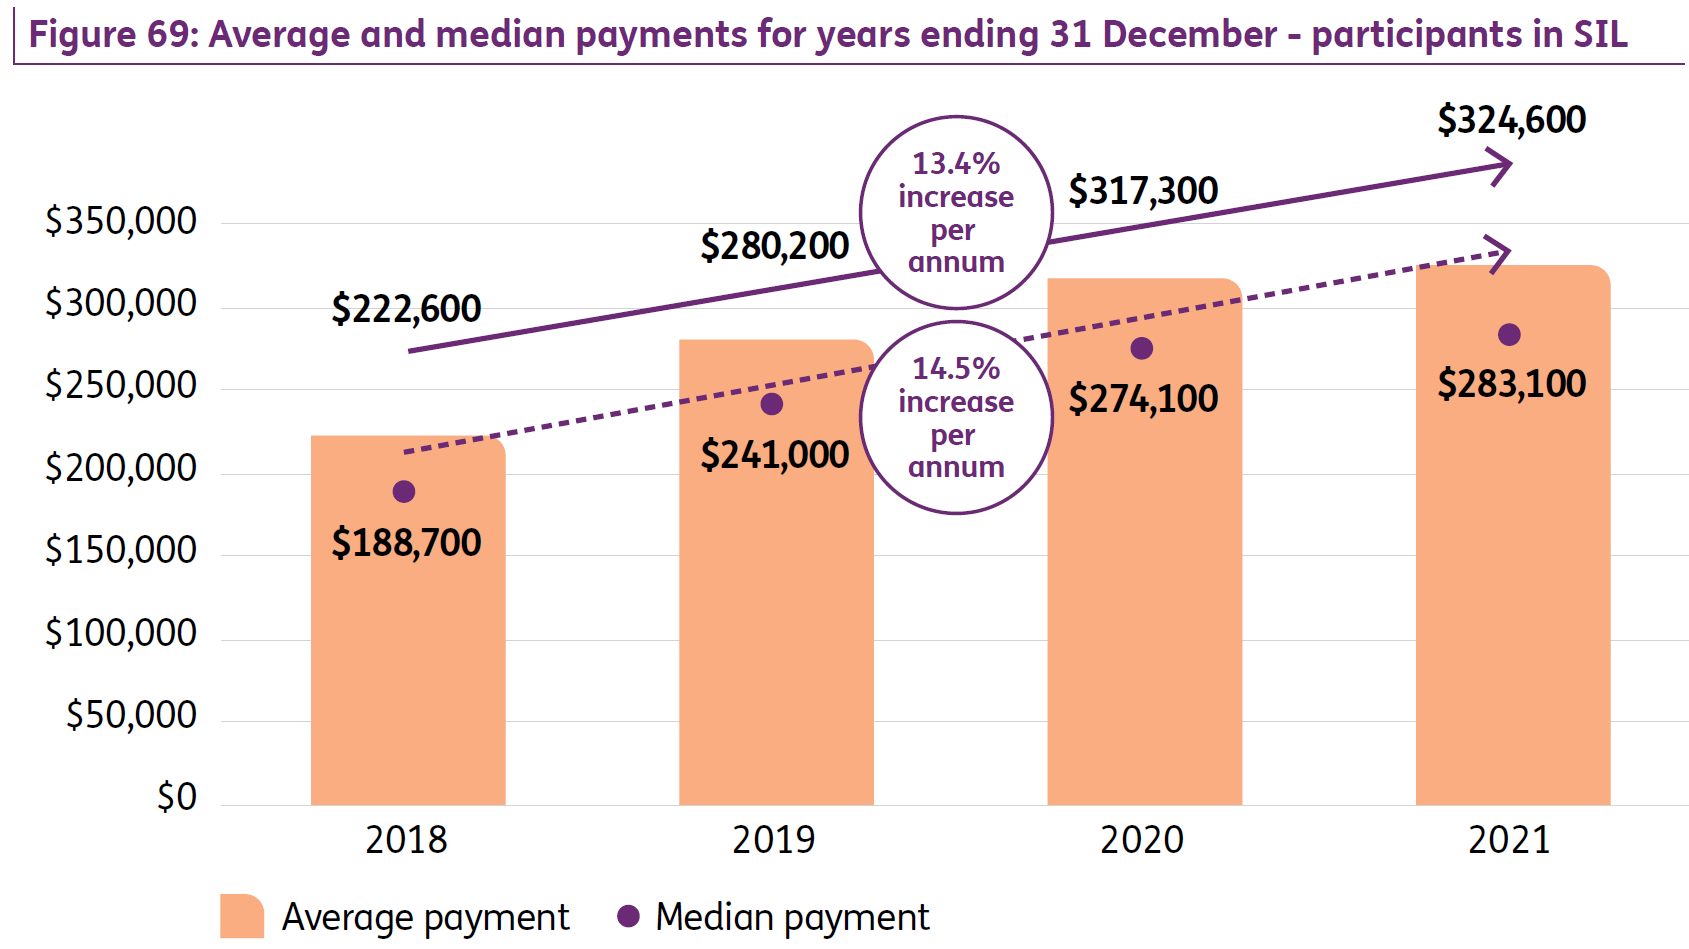
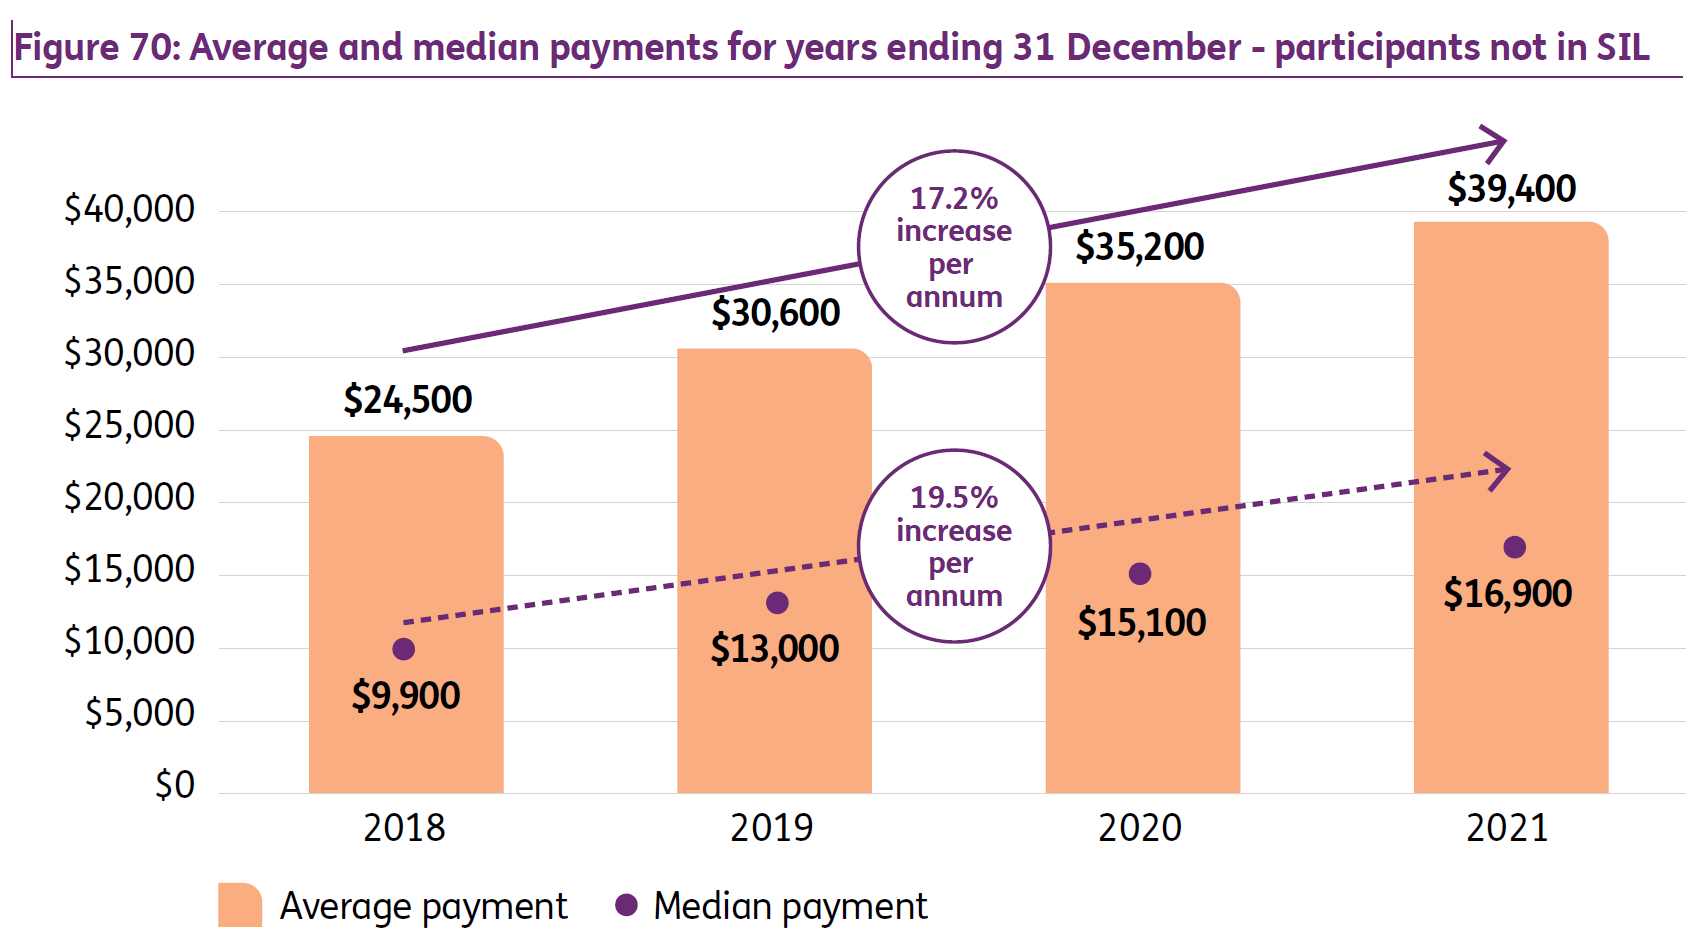
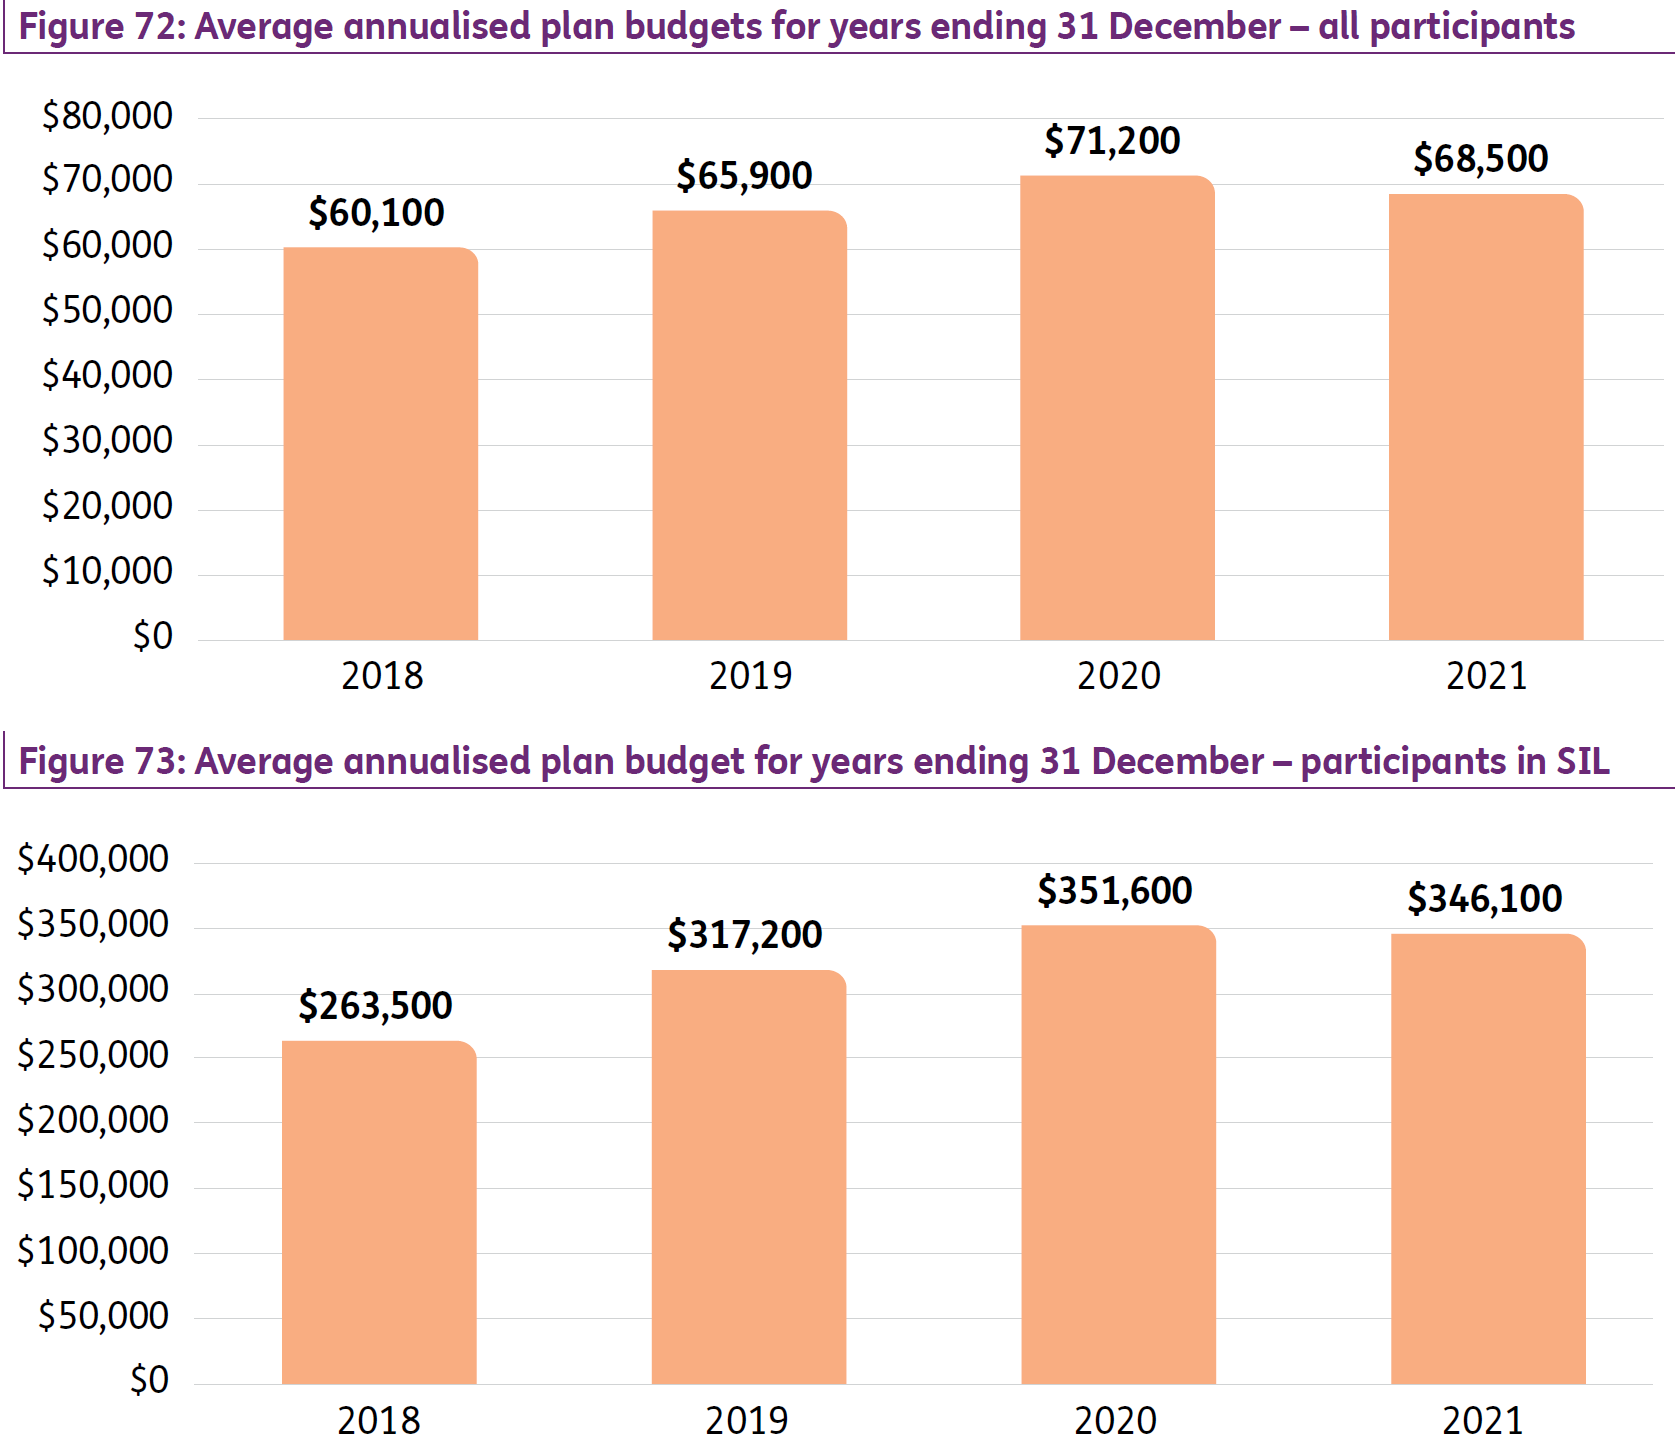
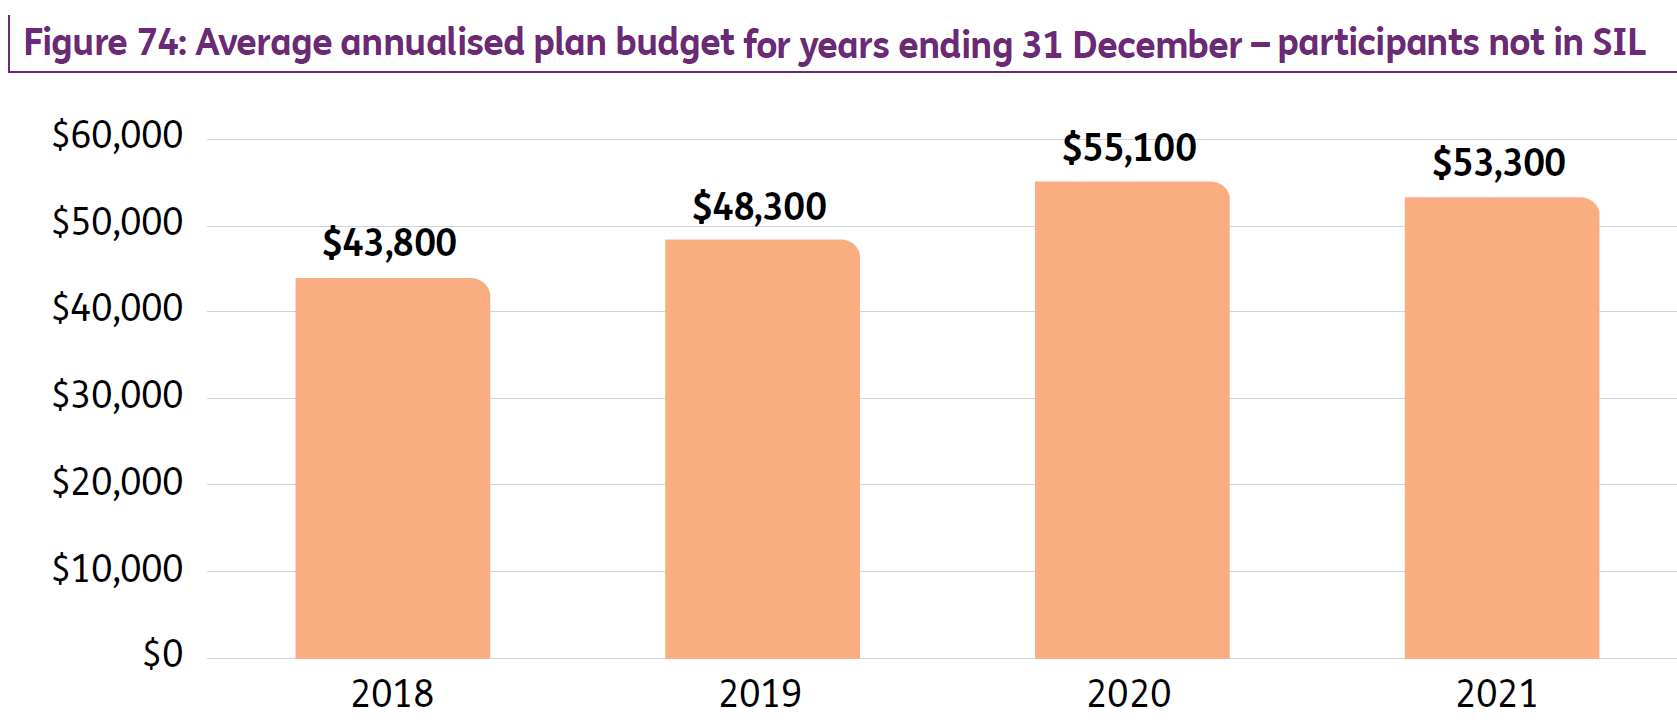
DIA were pleased to see that the Median values of Payments has been included rather than just presenting the Average values. This provides an extra layer of context that has been sorely missing from much of the financial sustainability commentary from the NDIA. DIA would like to see this extended to the Plan Budget data which is still only presented as Averages.
Complaints and AAT Cases Rising
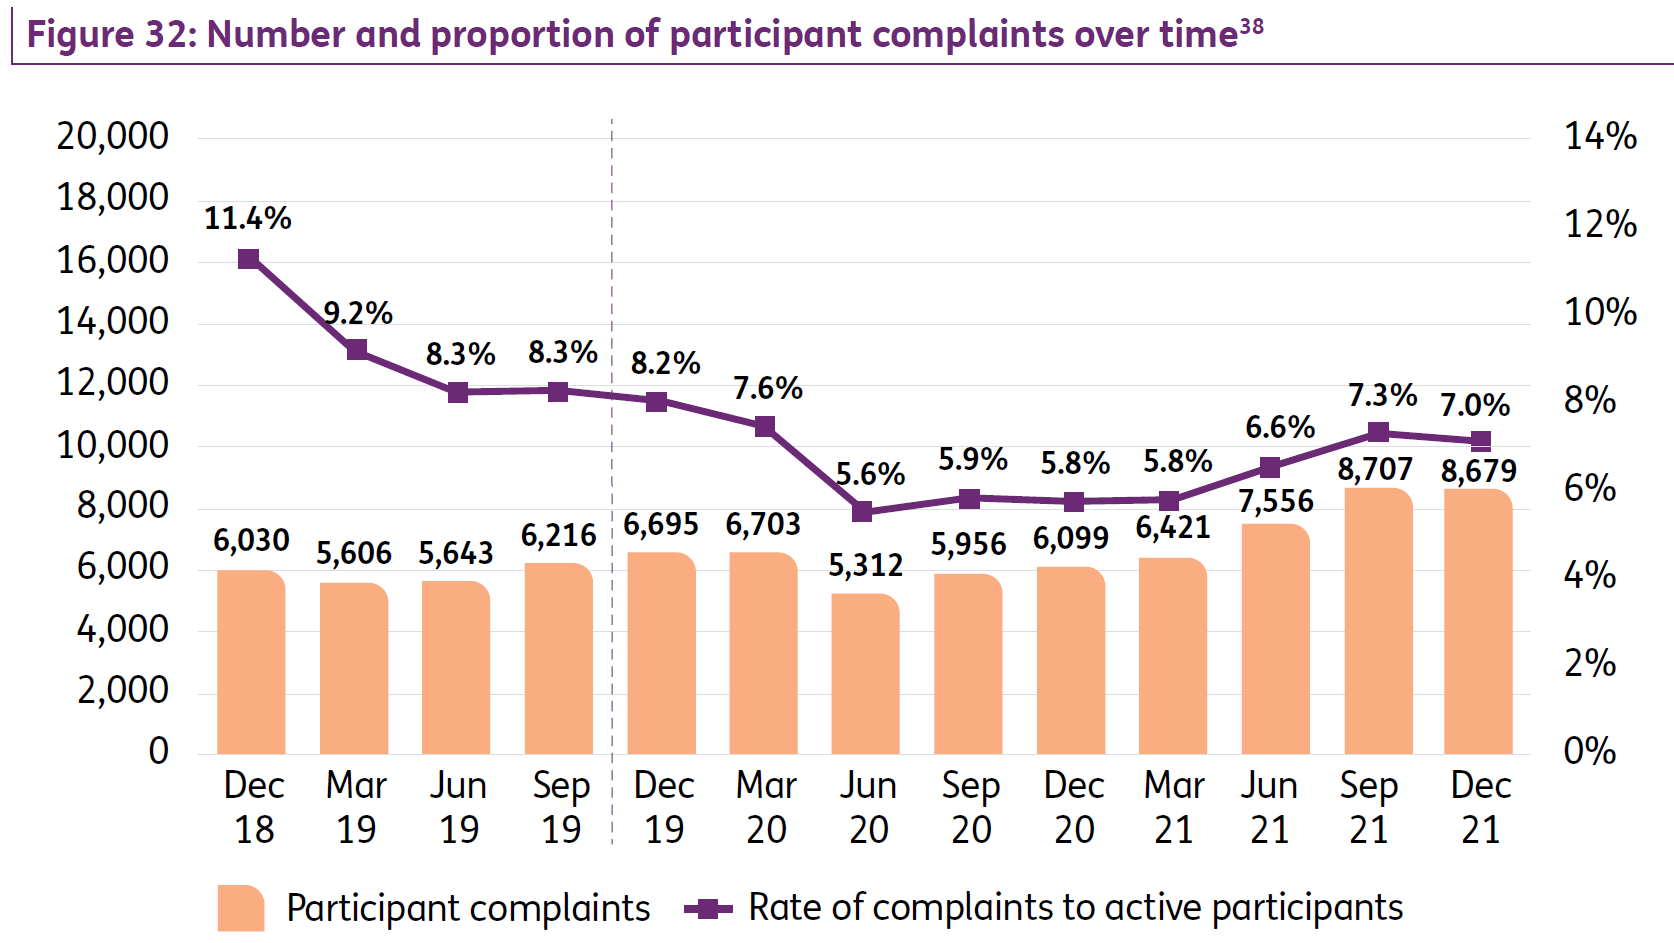
Unfortunately, 2021 will not go down as one of great success for the NDIA. Given the numerous missteps the NDIA made last year it is not surprising, even to the casual observer, that both complaints and AAT cases have risen from Scheme lows just over 18 months ago. DIA, and the broader disability community, would be hoping that the trends in complaints and AAT cases can be reversed in 2022.
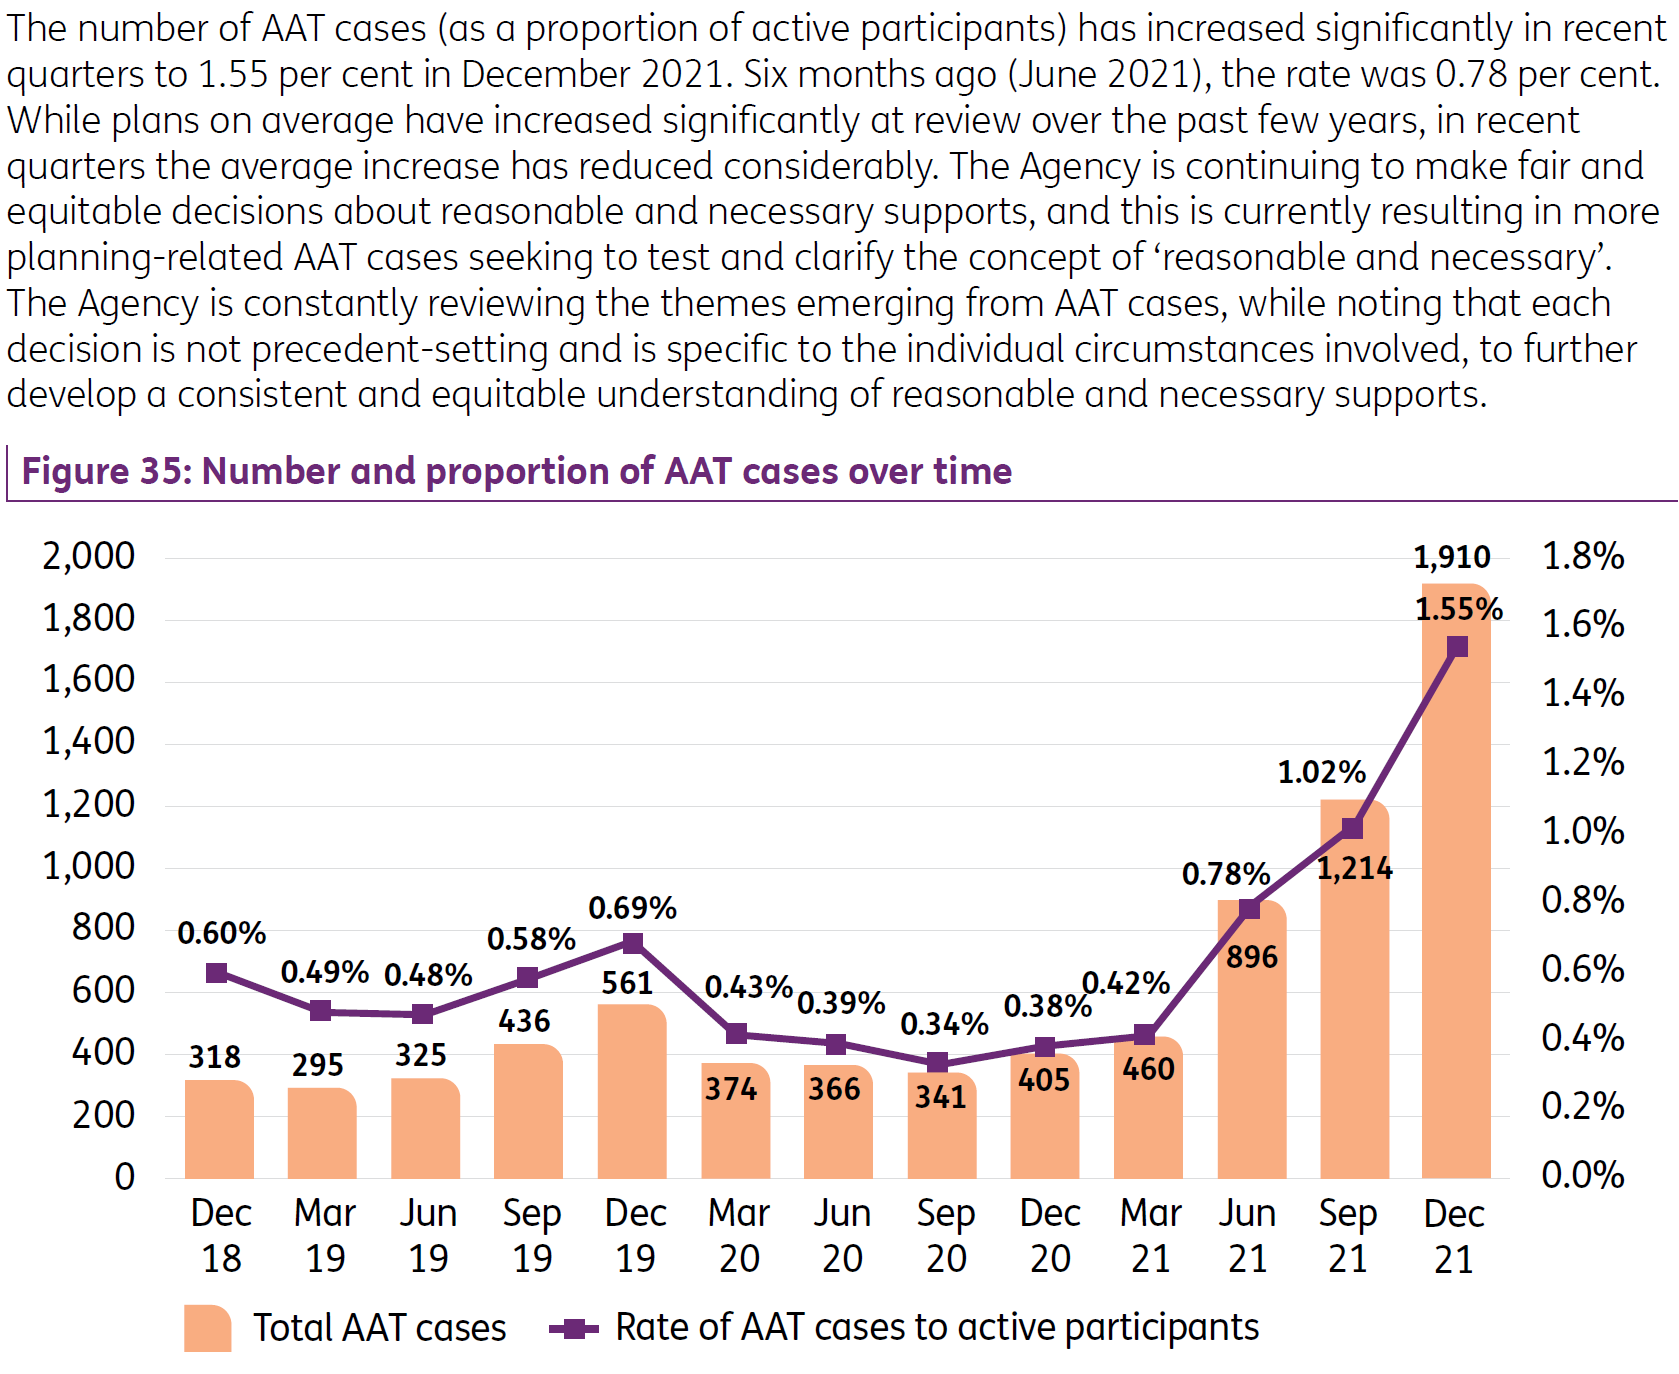
The above graph showing the number of AAT cases only has one explanation; there has been a significant increase which is a stark metric of the gap between the NDIA and many participants.
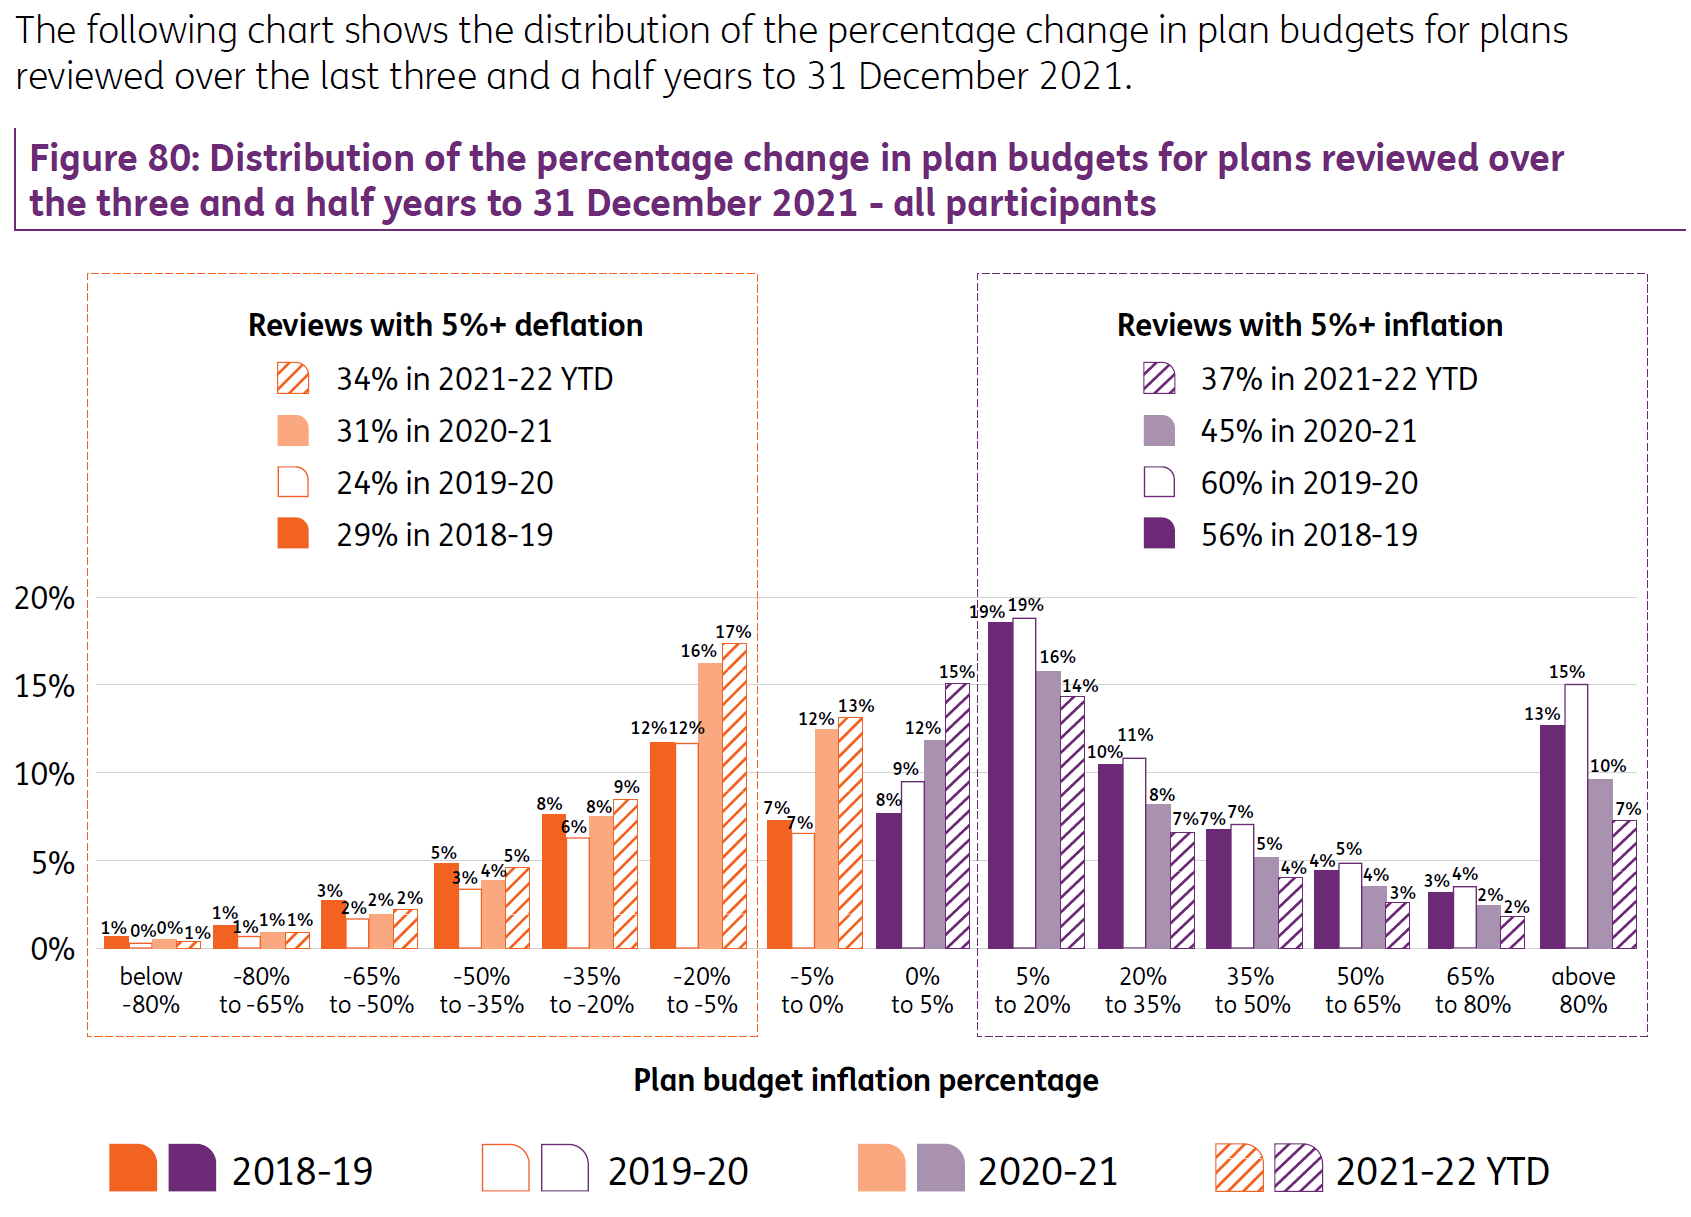
Plan Deflation Is Occurring
Over the 3 and half years to December 2021 there has been an increase in the number of plans being reviewed that have more than 5% reduction in value (29% in 2019 to 34% in 2021). Conversely, the number of plans that have had an increase of more than 5% has decreased significantly from 56% in 2019 to 37% in 2021.
Anecdotally, DIA continues to hear that plan deflation has increased significantly during the second half of 2021 (possibly a major cause of the jump in complaints and AAT cases) and that the practice of keeping the value constant but extending the duration has also been prevalent. DIA would again question if the data presented by the NDIA accounts for this plan extension deflation effect.
It is increasingly difficult to get a clear picture of where the Scheme is actually headed as the messaging from the NDIA becomes more and more scrambled. More data isn’t necessarily better in this instance. It would be far more beneficial if clear, transparent and consistent data was provided giving participants and stakeholders the information required so that informed and constructive conversations can be had to make the NDIS all it can and should be.
CONCLUSION
Before we look specifically at Plan Management and Support Coordination, a few closing thoughts on the 2021 – 2022 Q2 Quarterly Report. In summary essentially more of the same (with a few adjustments from the NDIA). As a quick (if you can call 661 pages quick) snapshot of how the Scheme looks at the end of December 2021 it ticks the boxes but as per previous editions falls well short of providing the underlying transparency being called for from a growing number of parties. What is concerning is seeing the number of AAT cases continuing to rise, a sure sign that the NDIA has much work to do to regain the trust of the disability community.
PLAN MANAGEMENT AND SUPPORT COORDINATION DATA
Intermediaries continue to increase in popularity with Participants, who see the undeniable value and importance Plan Management and Support Coordination brings to the Scheme.
PLAN MANAGEMENT NATIONALLY
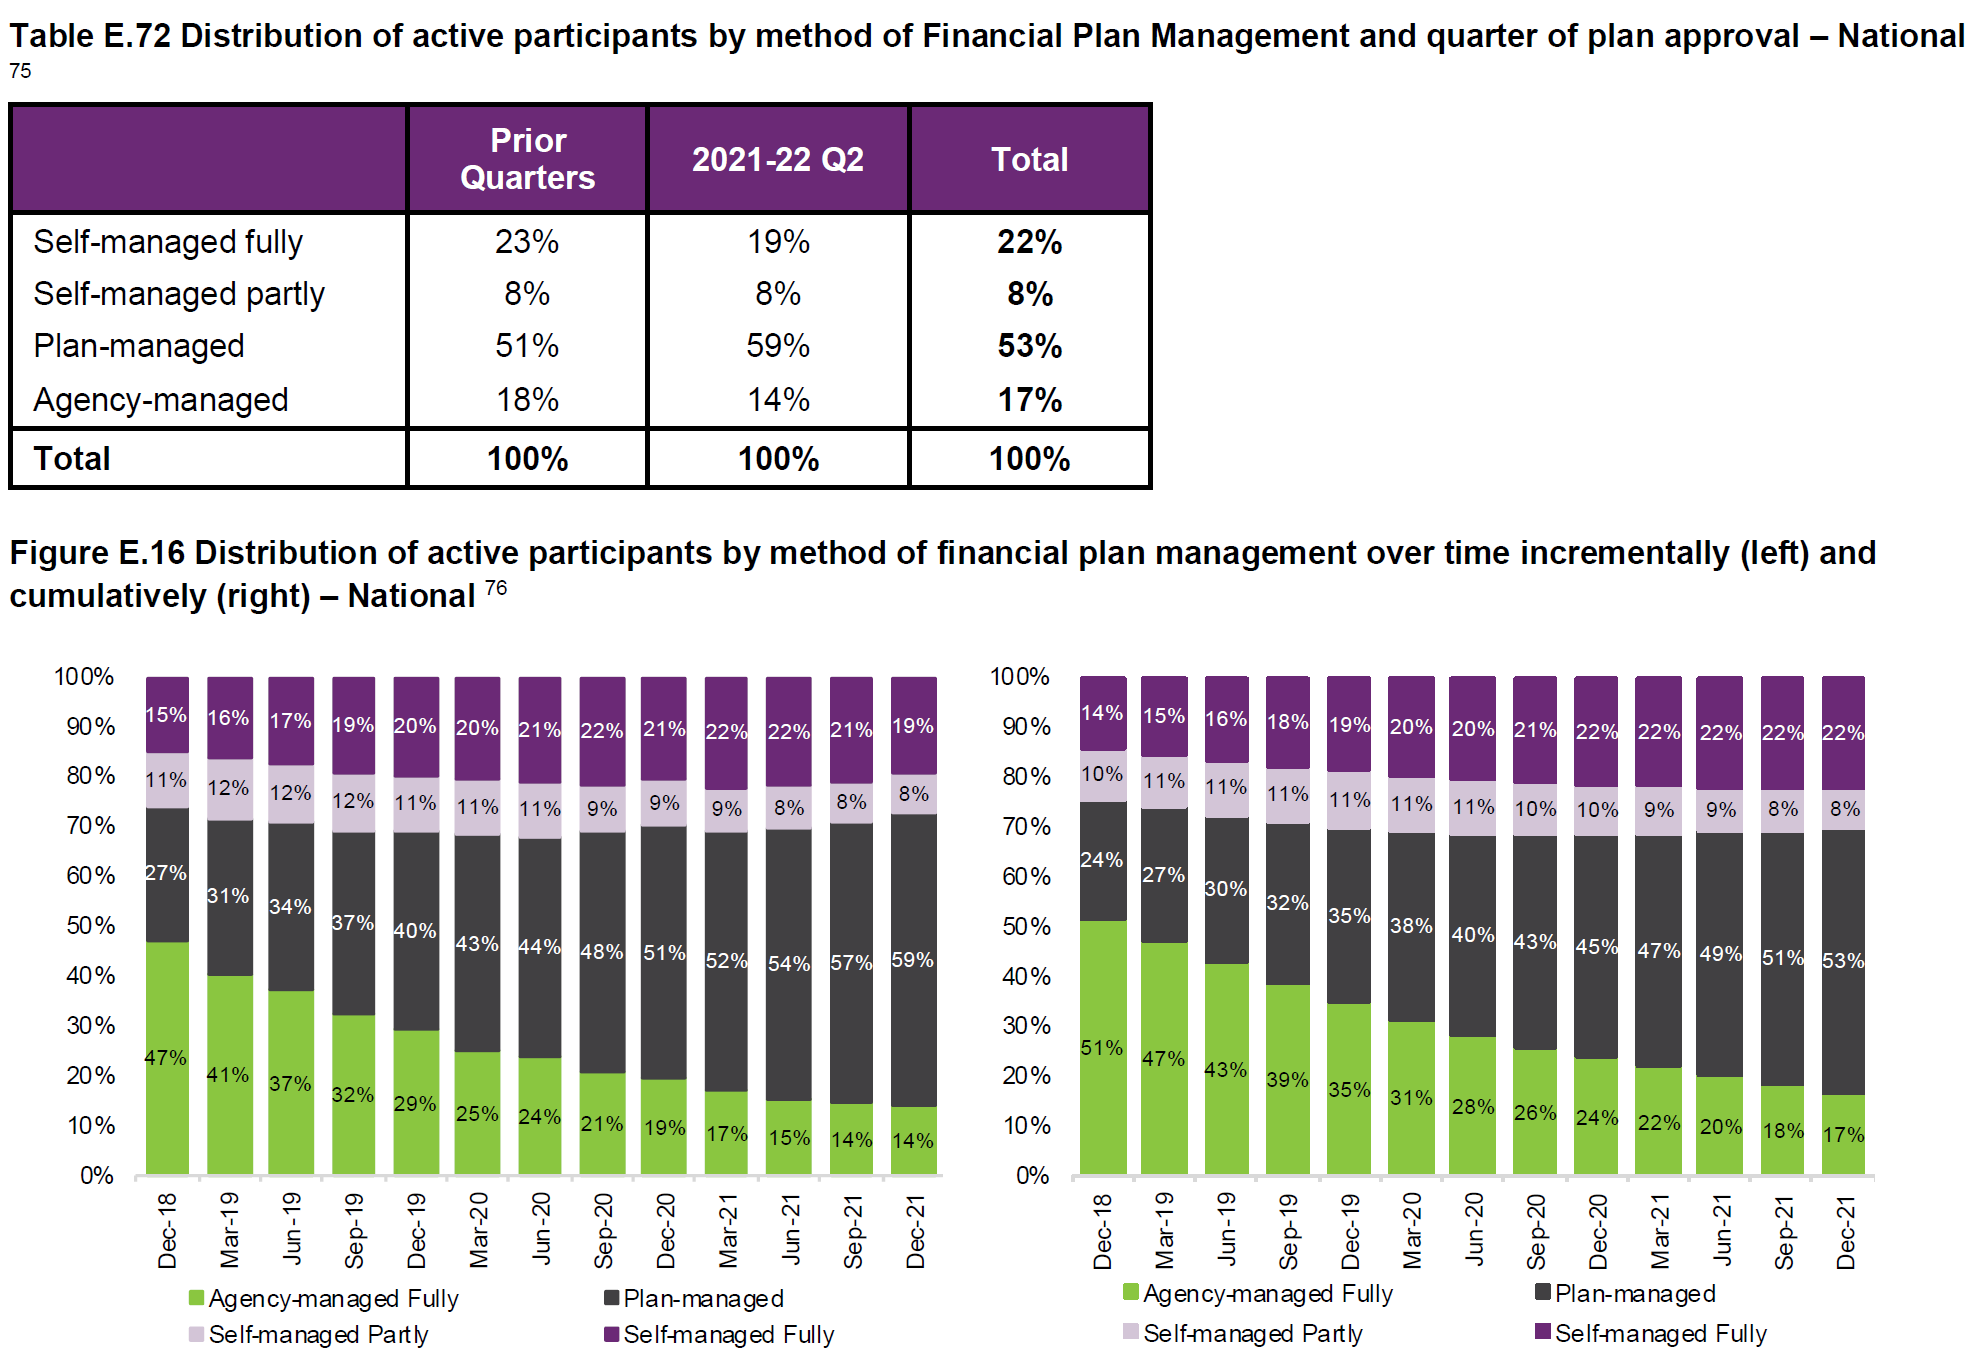
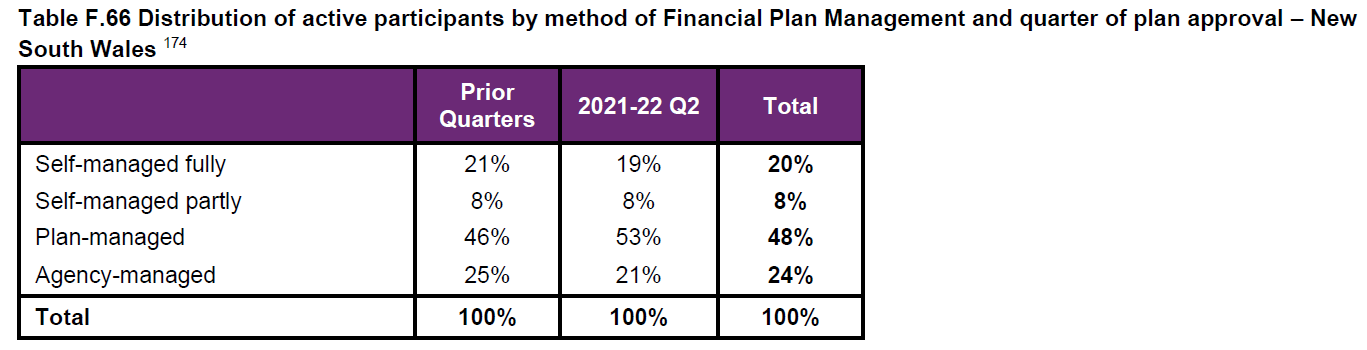
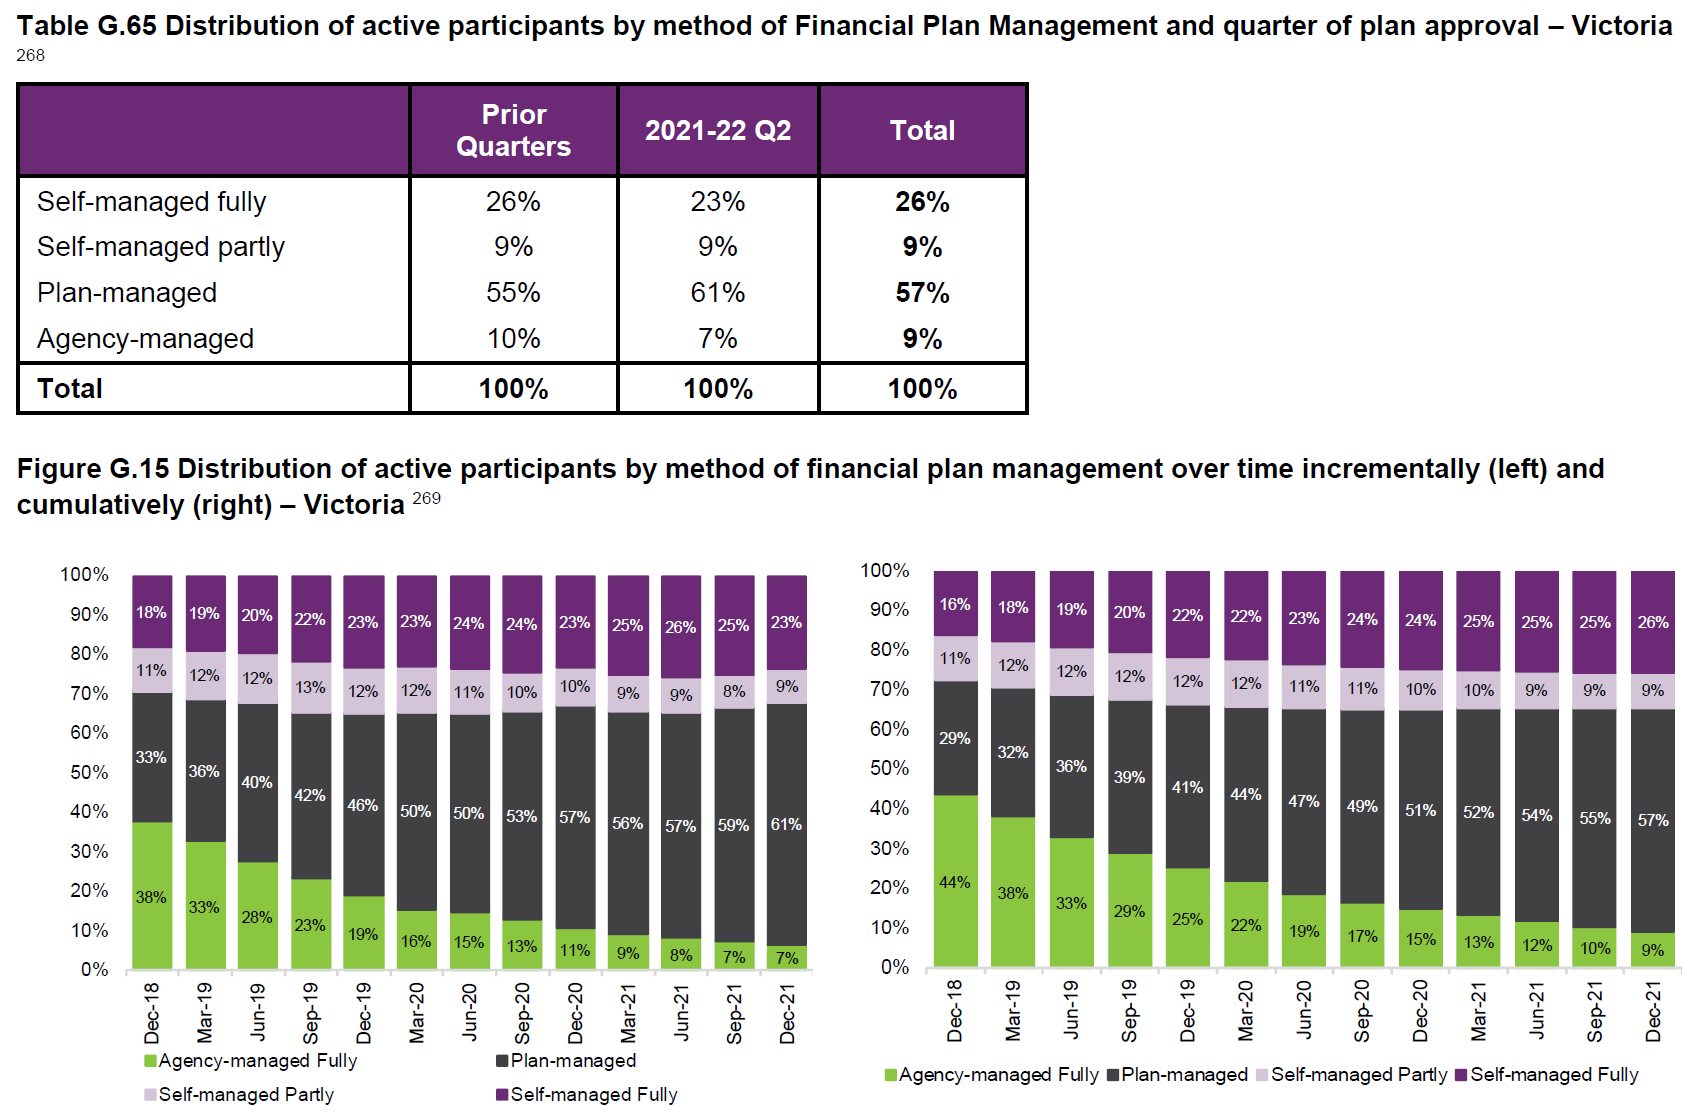
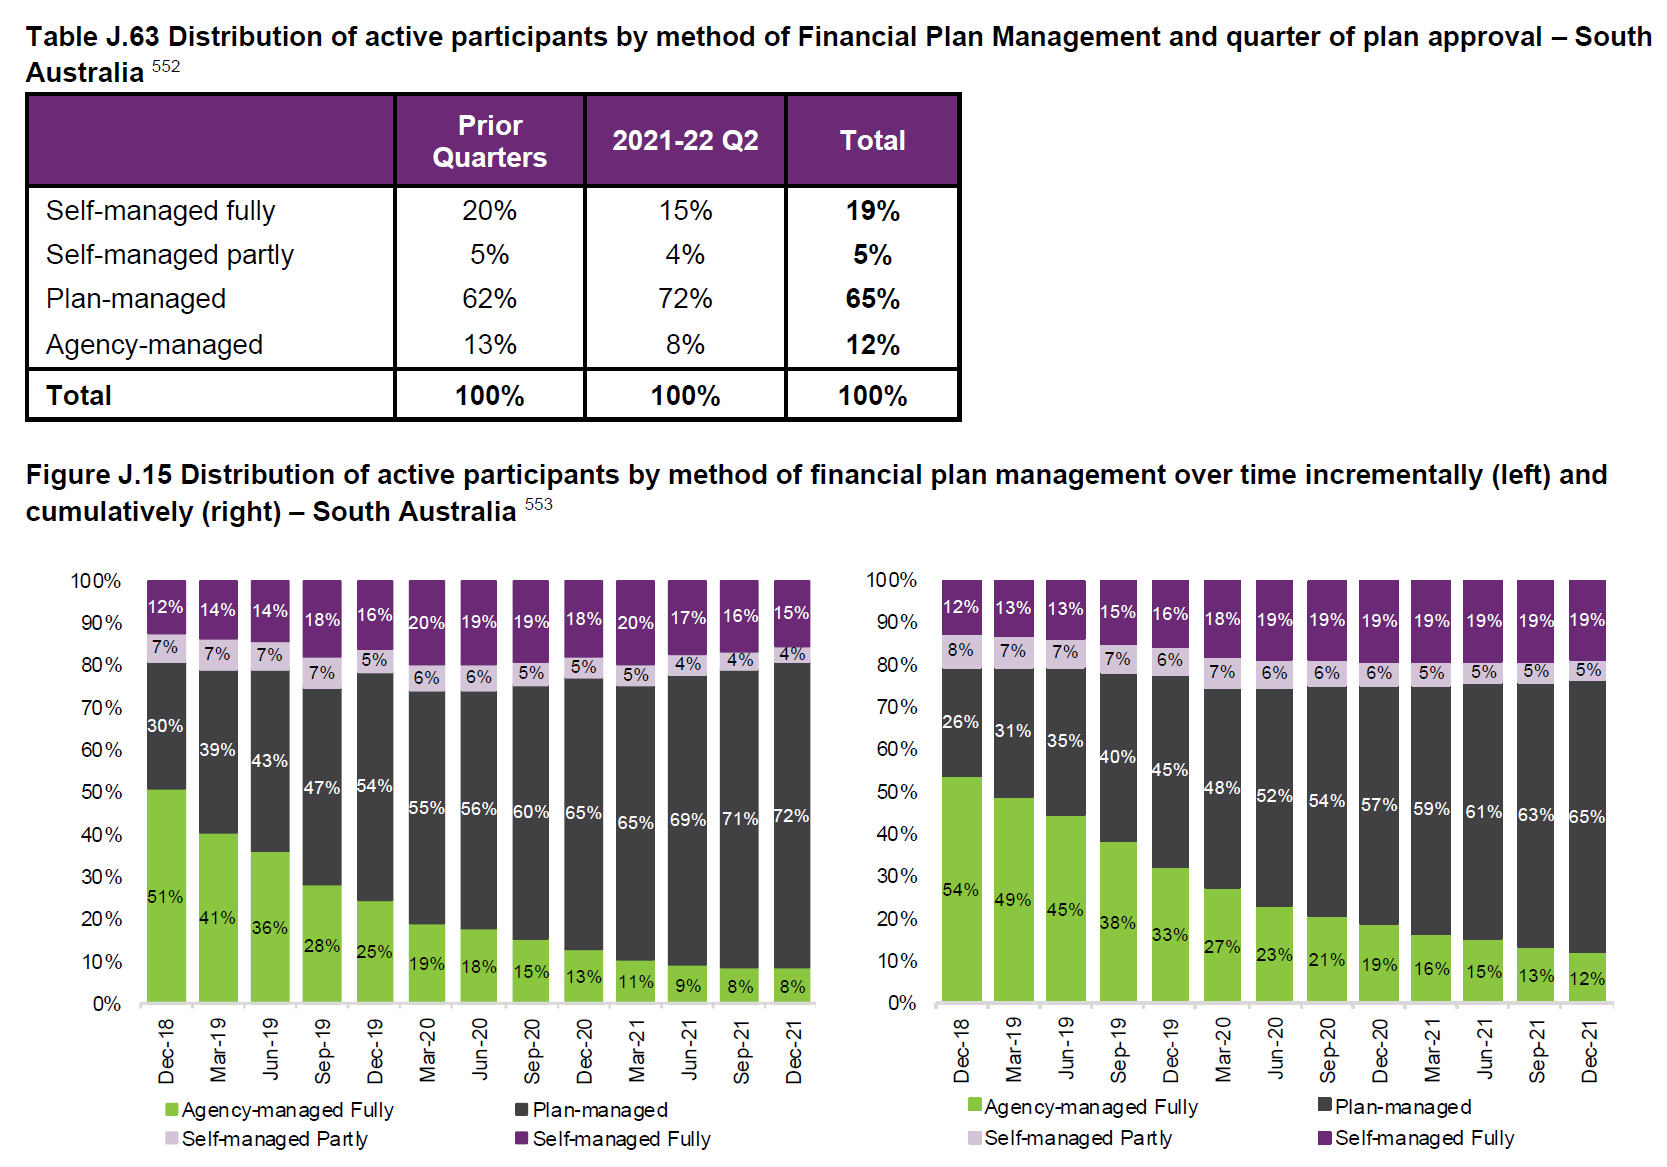
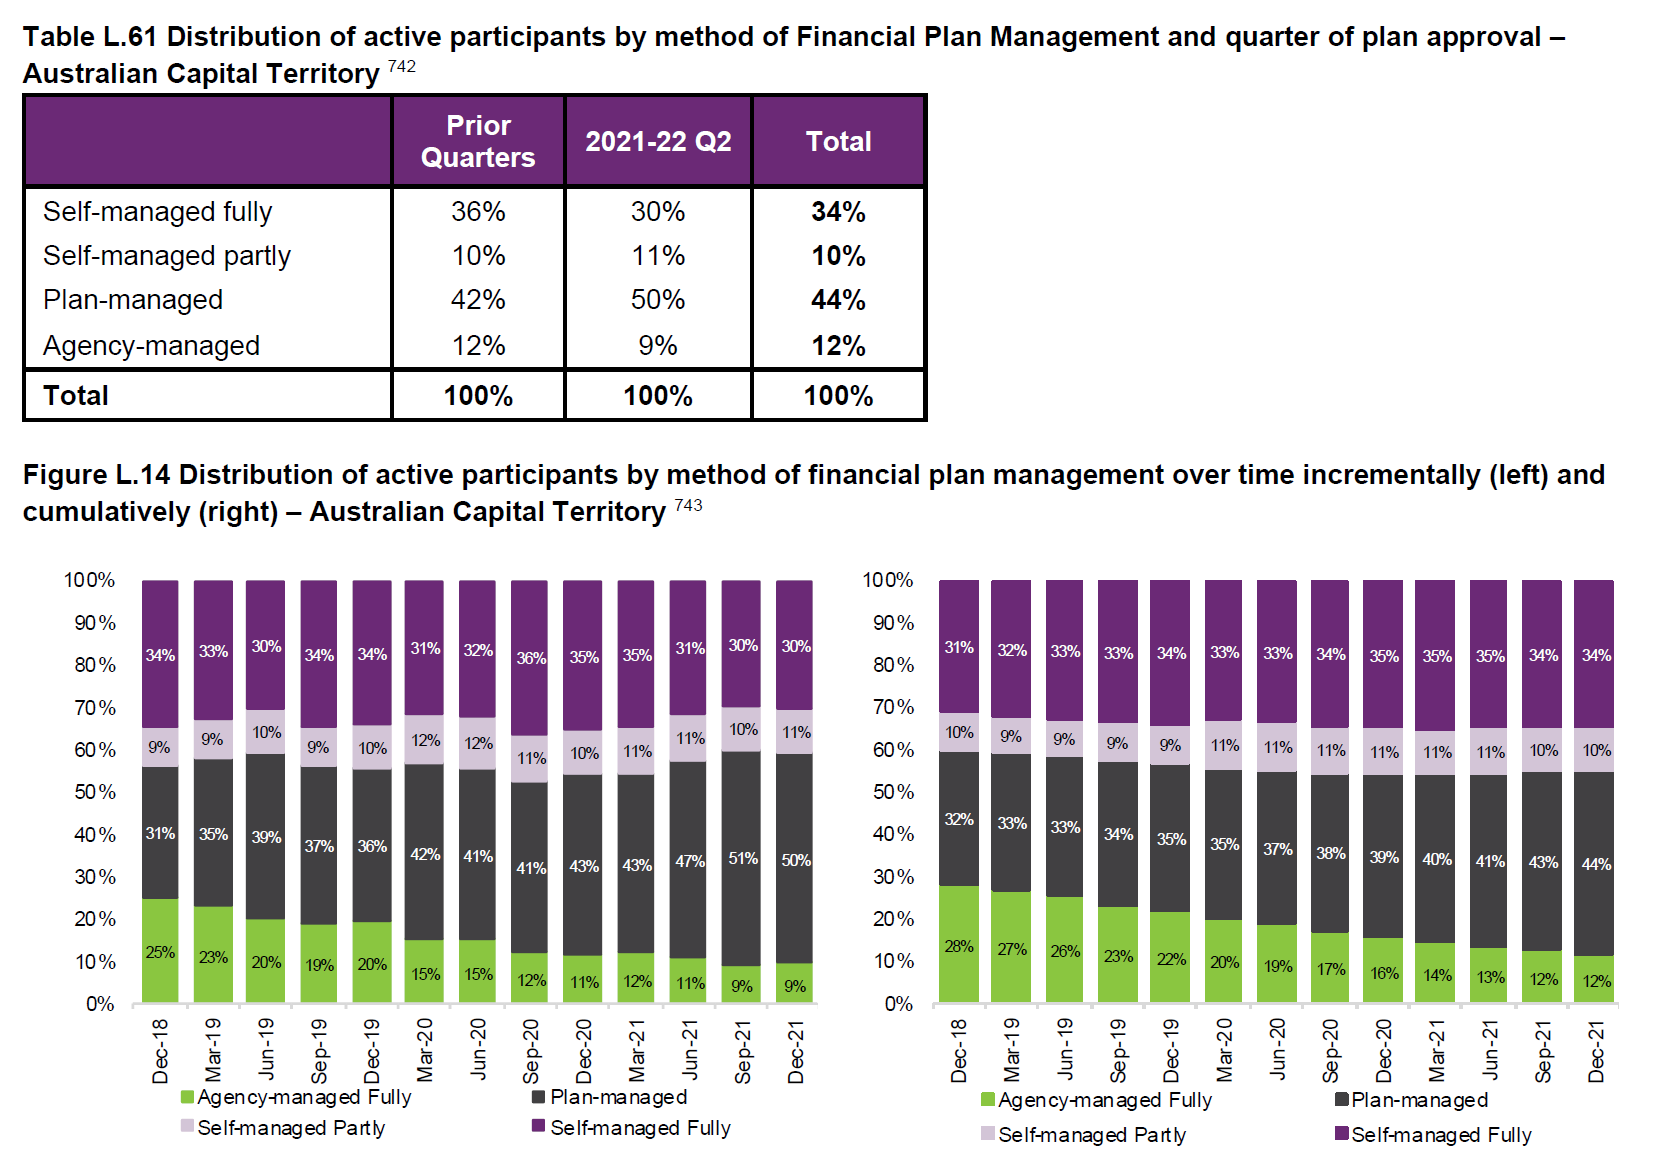
- In the last quarter 59% of participants elected to plan manage all or part of their plan nation-wide, an increase of 8% from prior quarters.
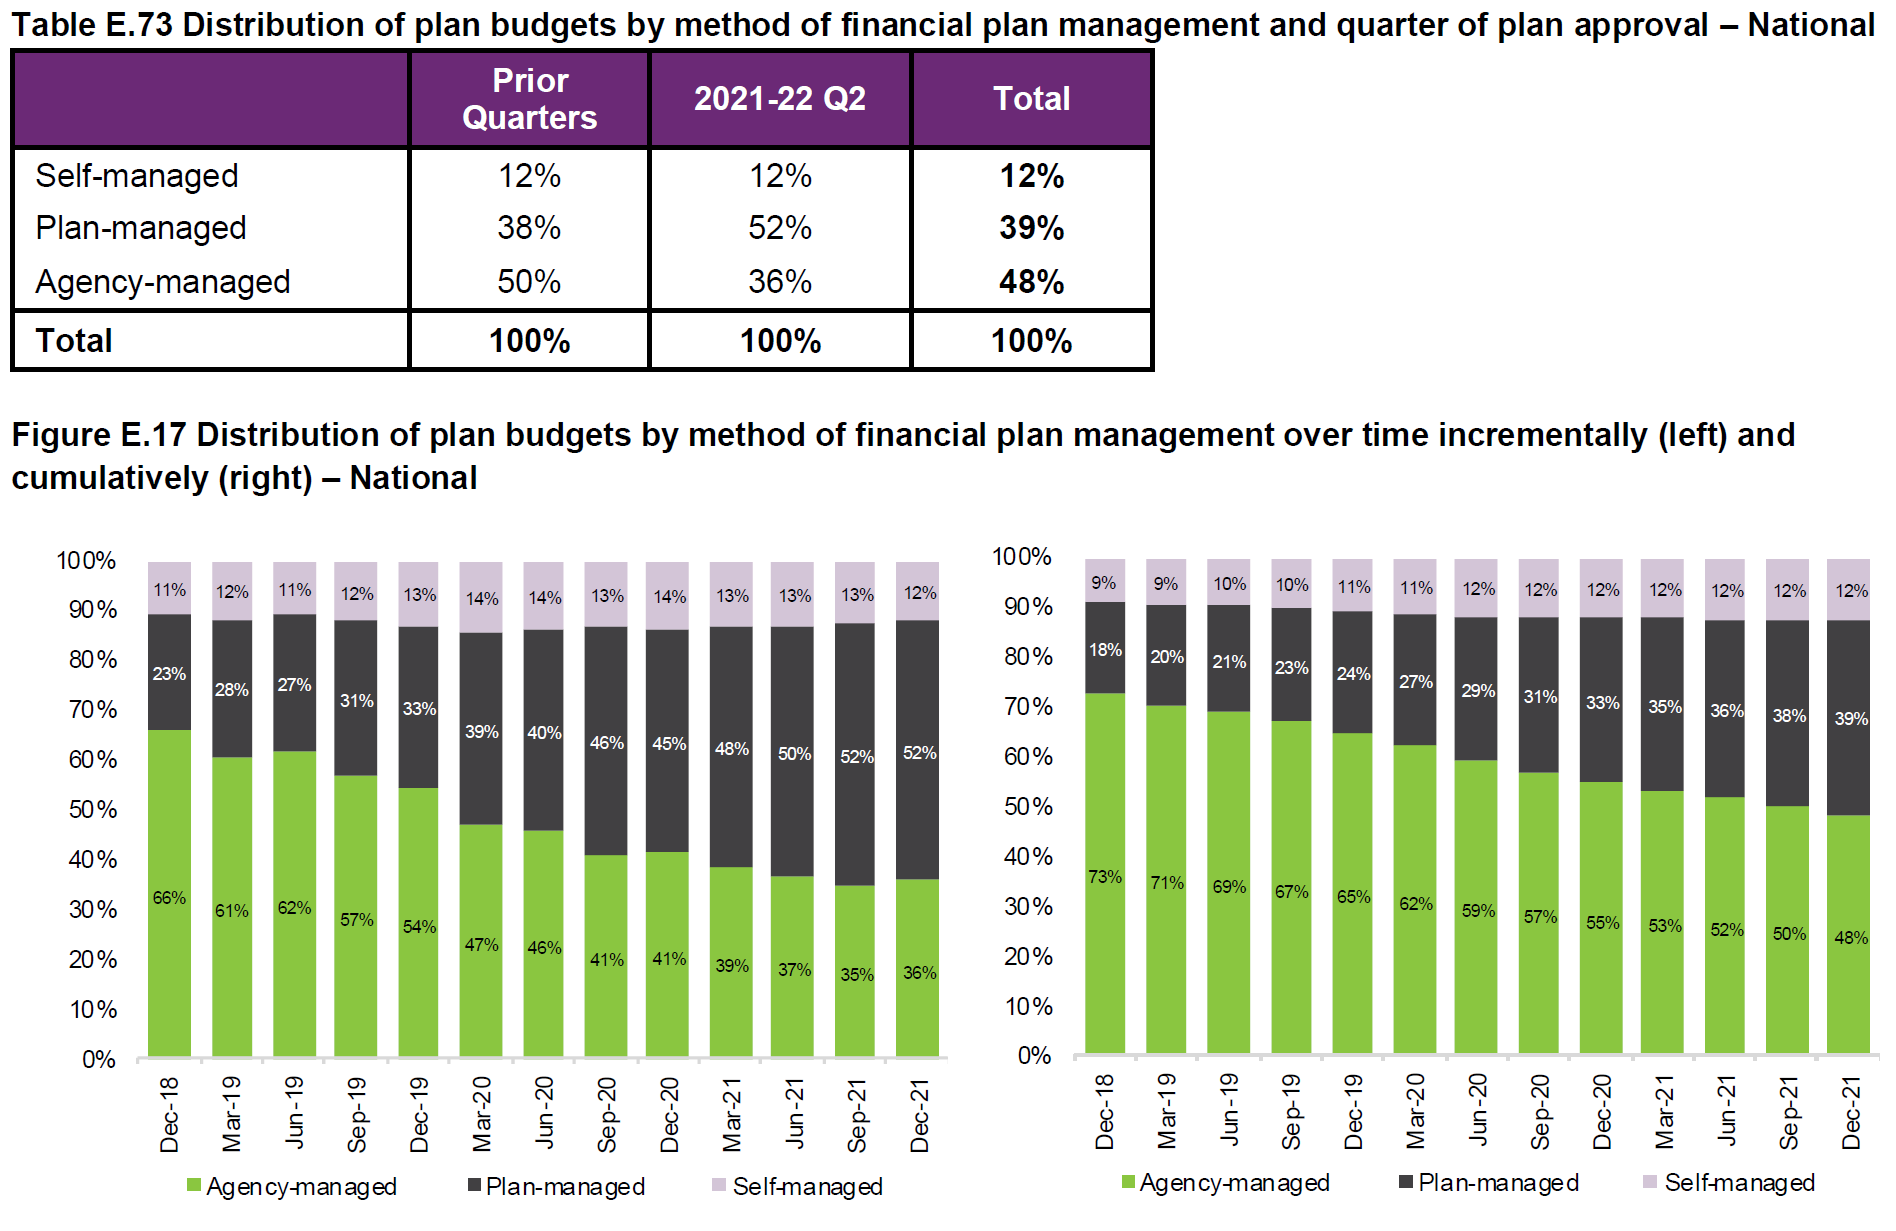
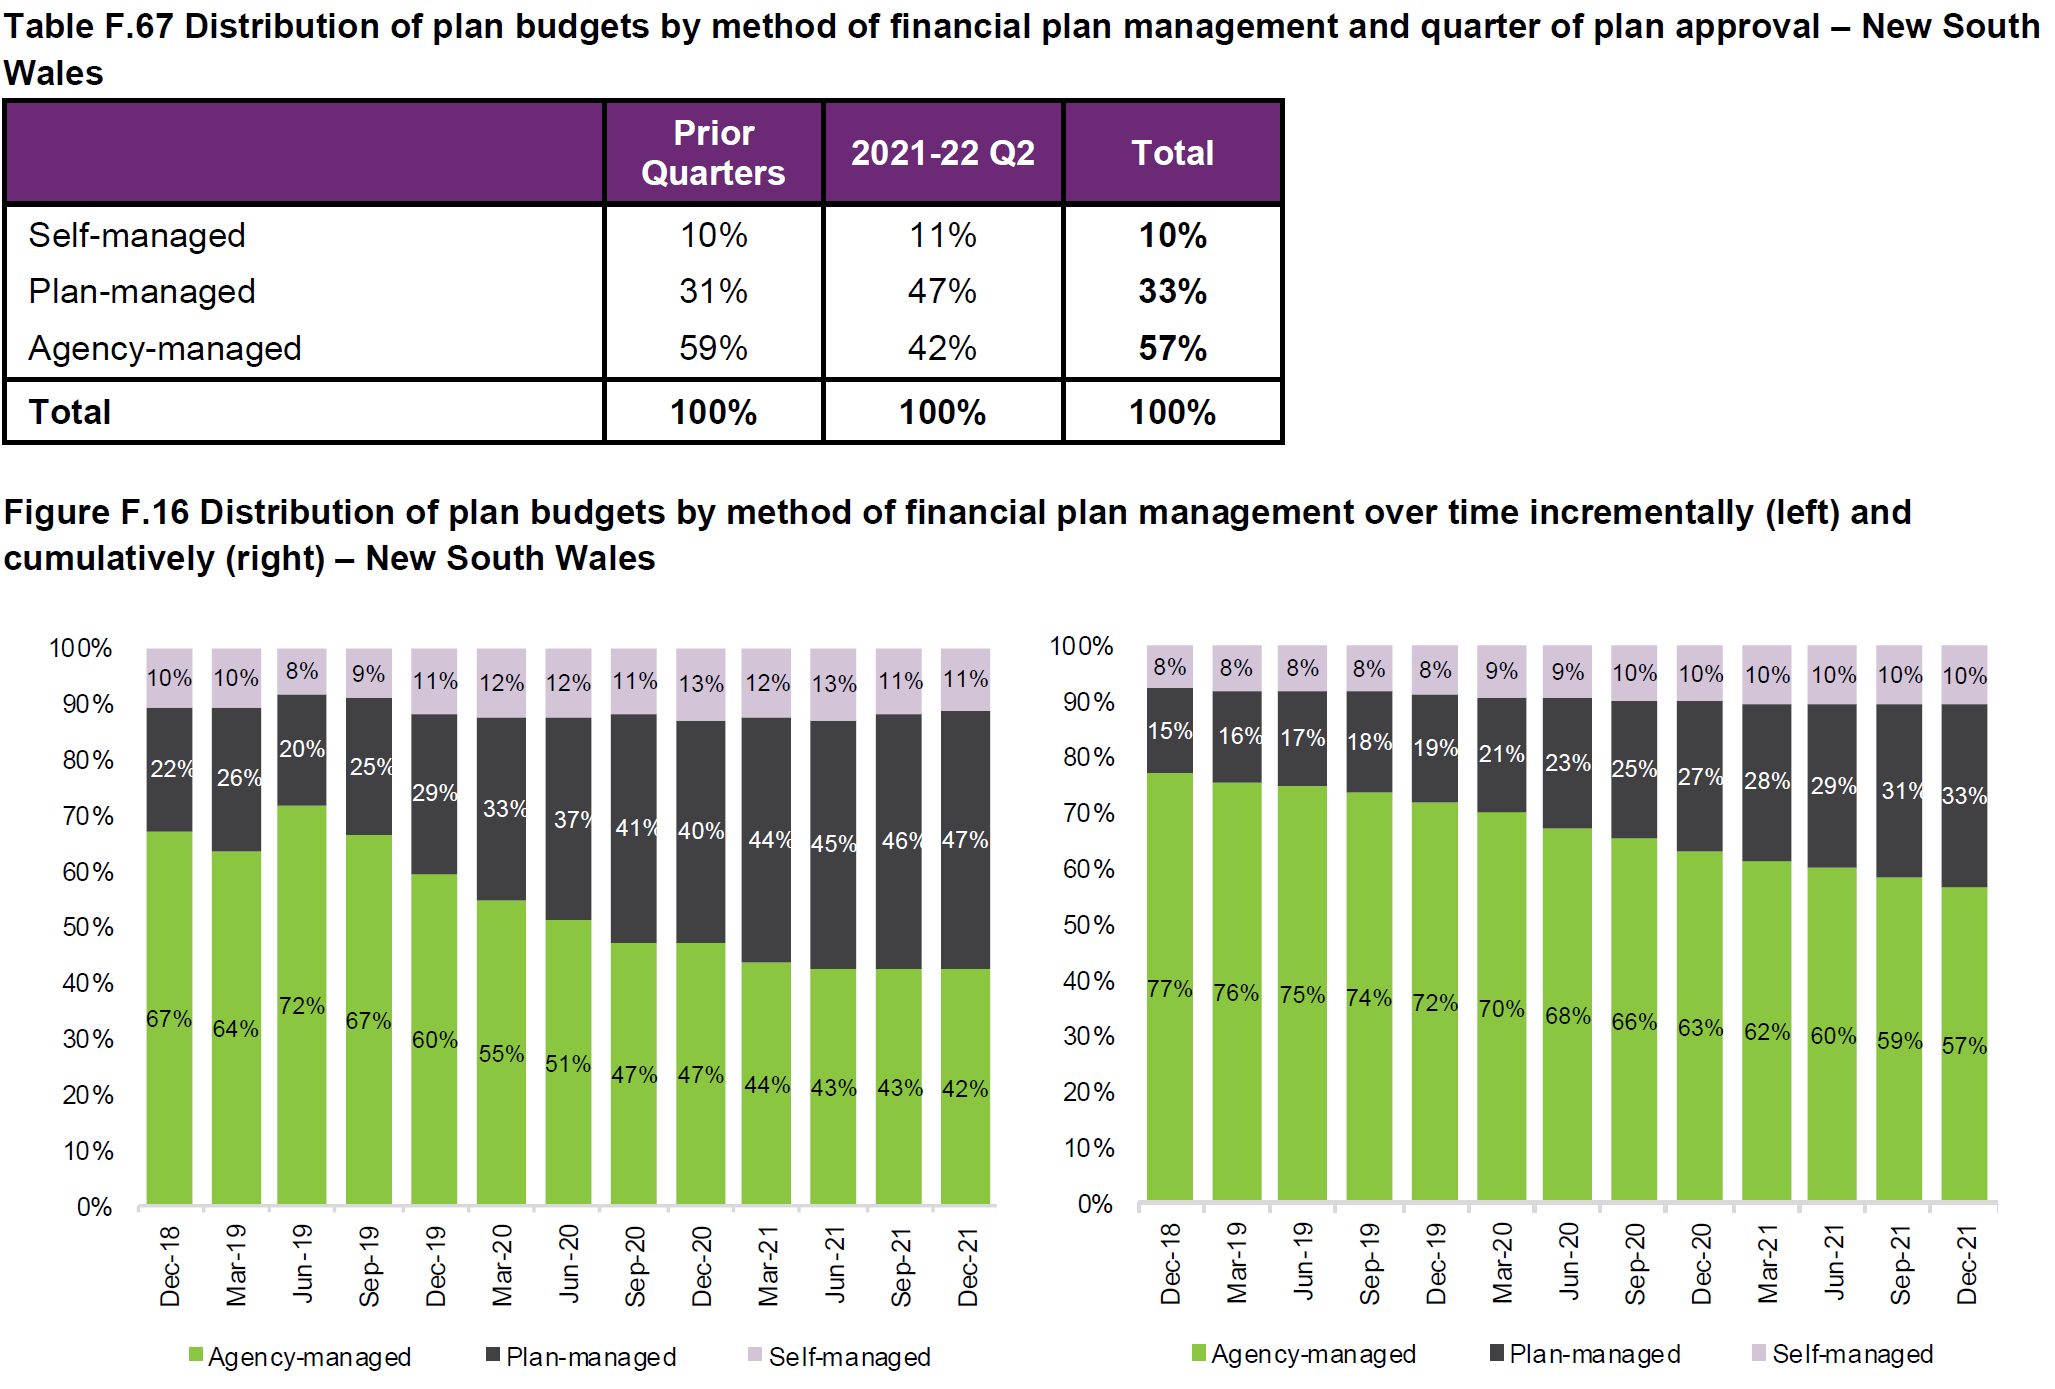
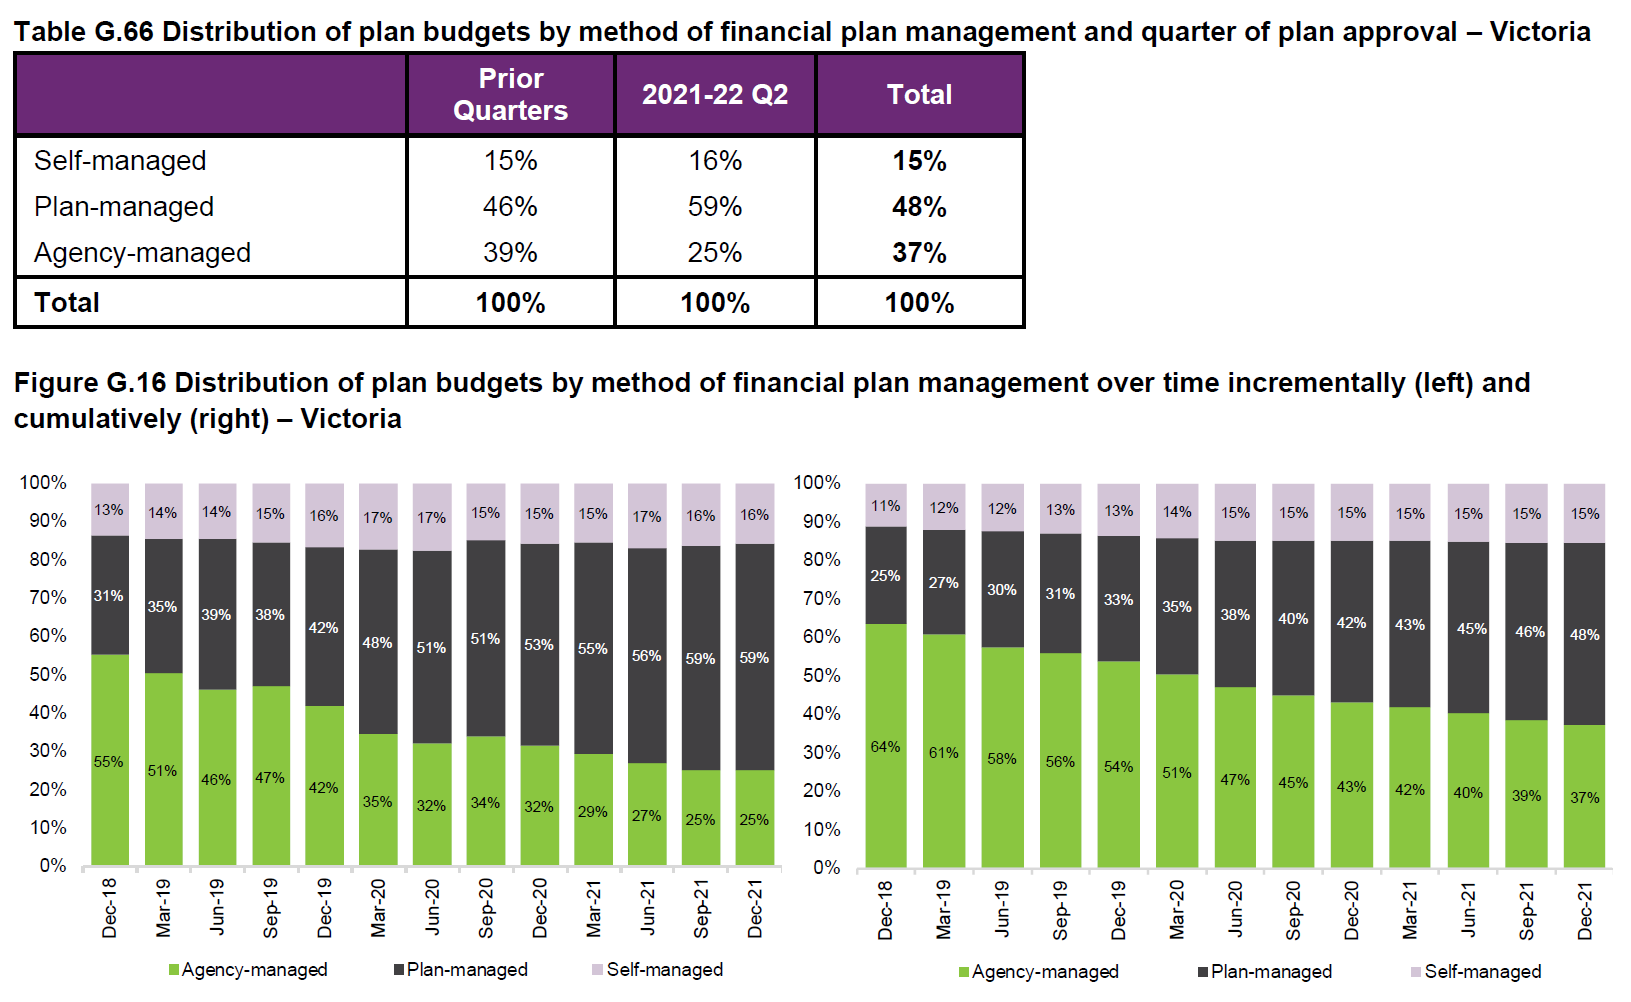
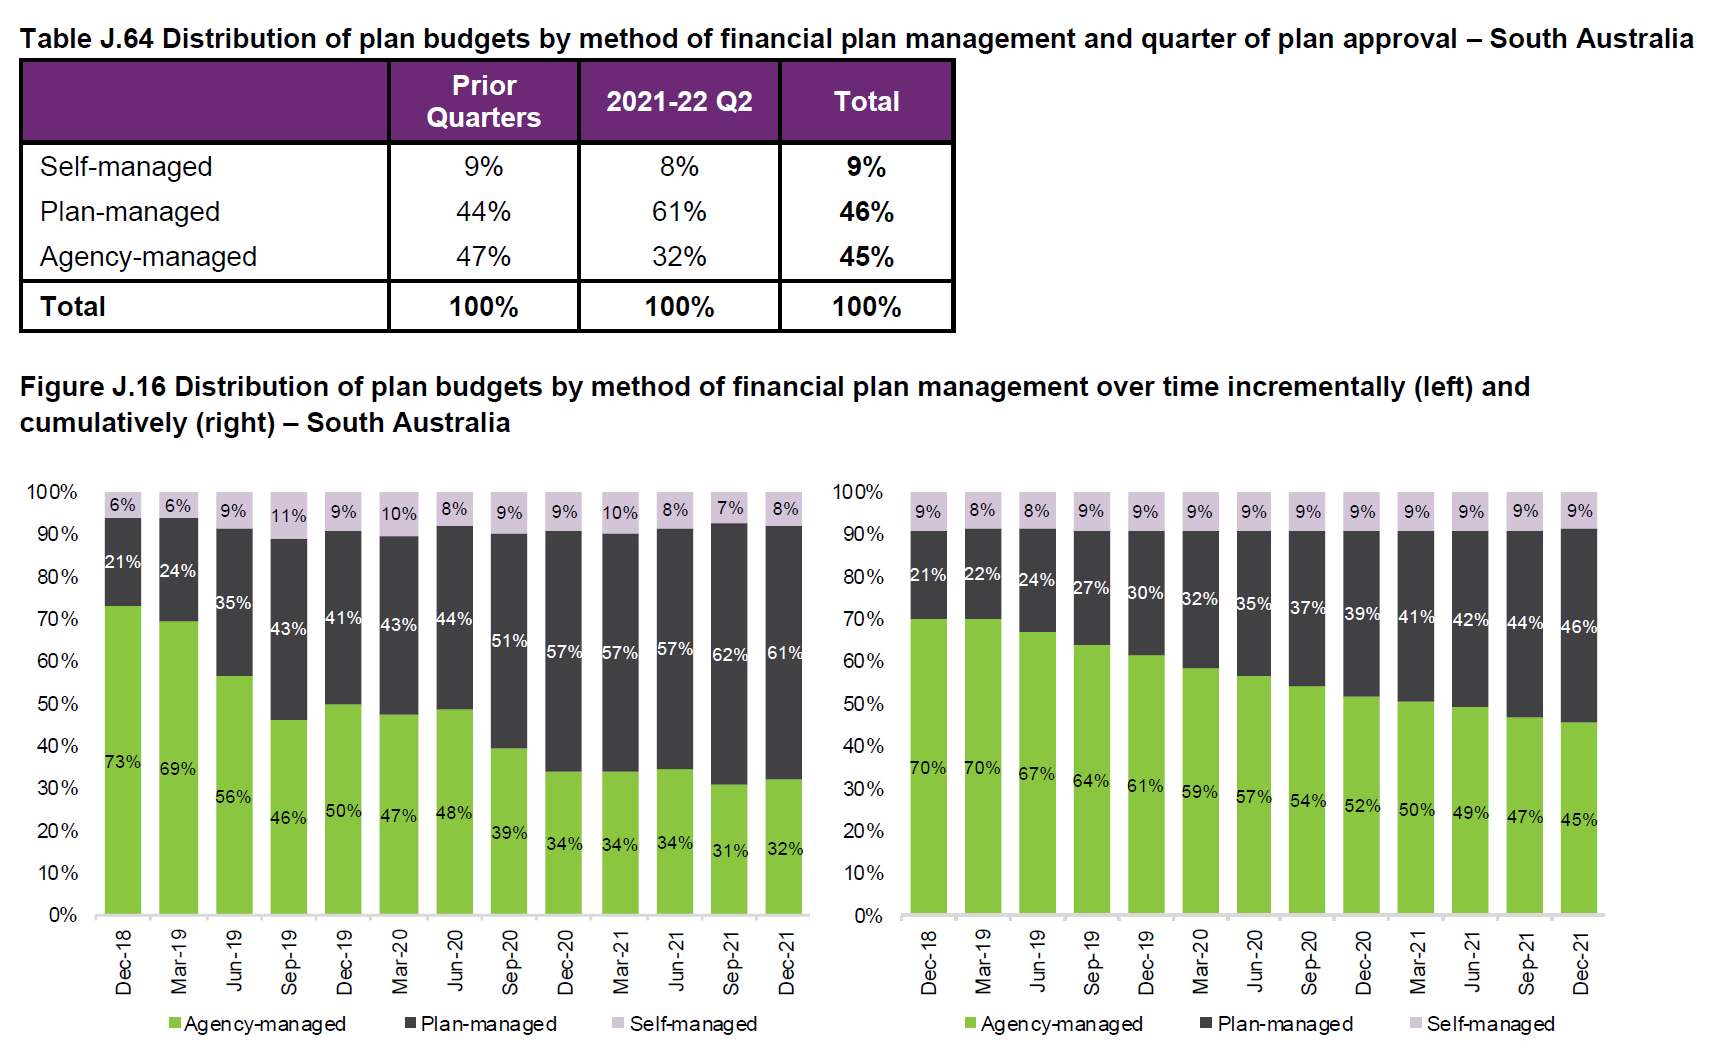
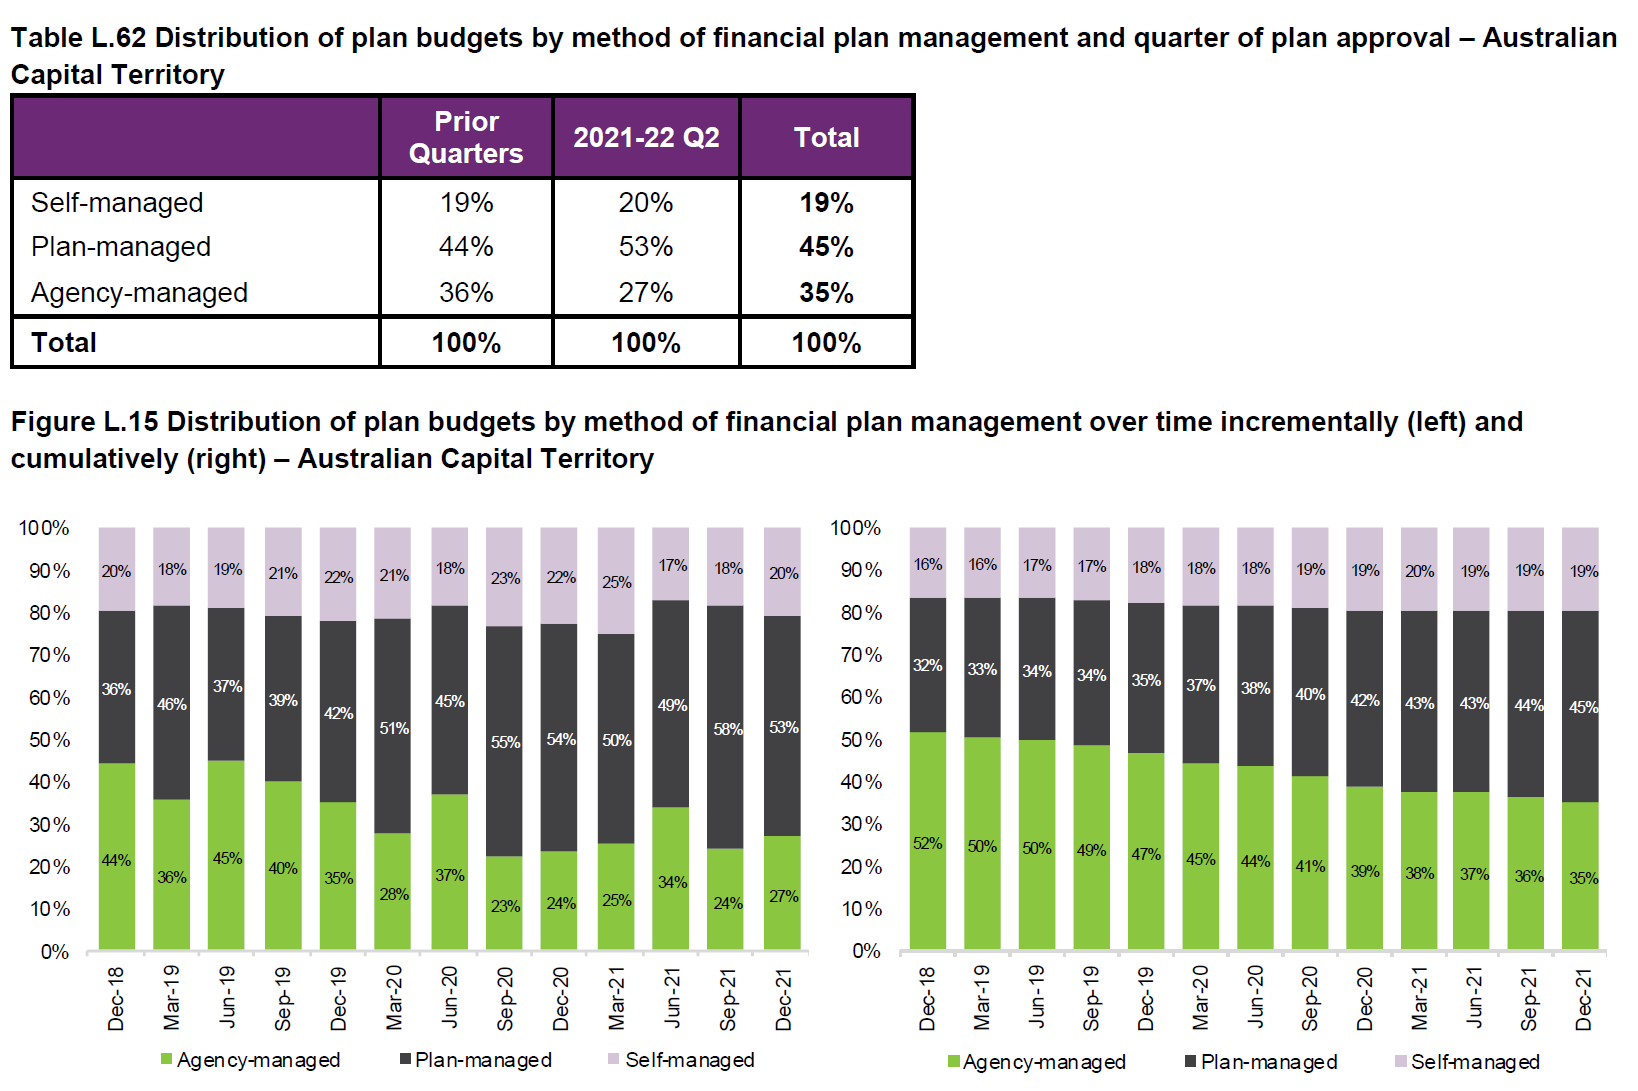
- In the last quarter 52% of plan budgets were plan managed, an increase of 14% from prior quarters.
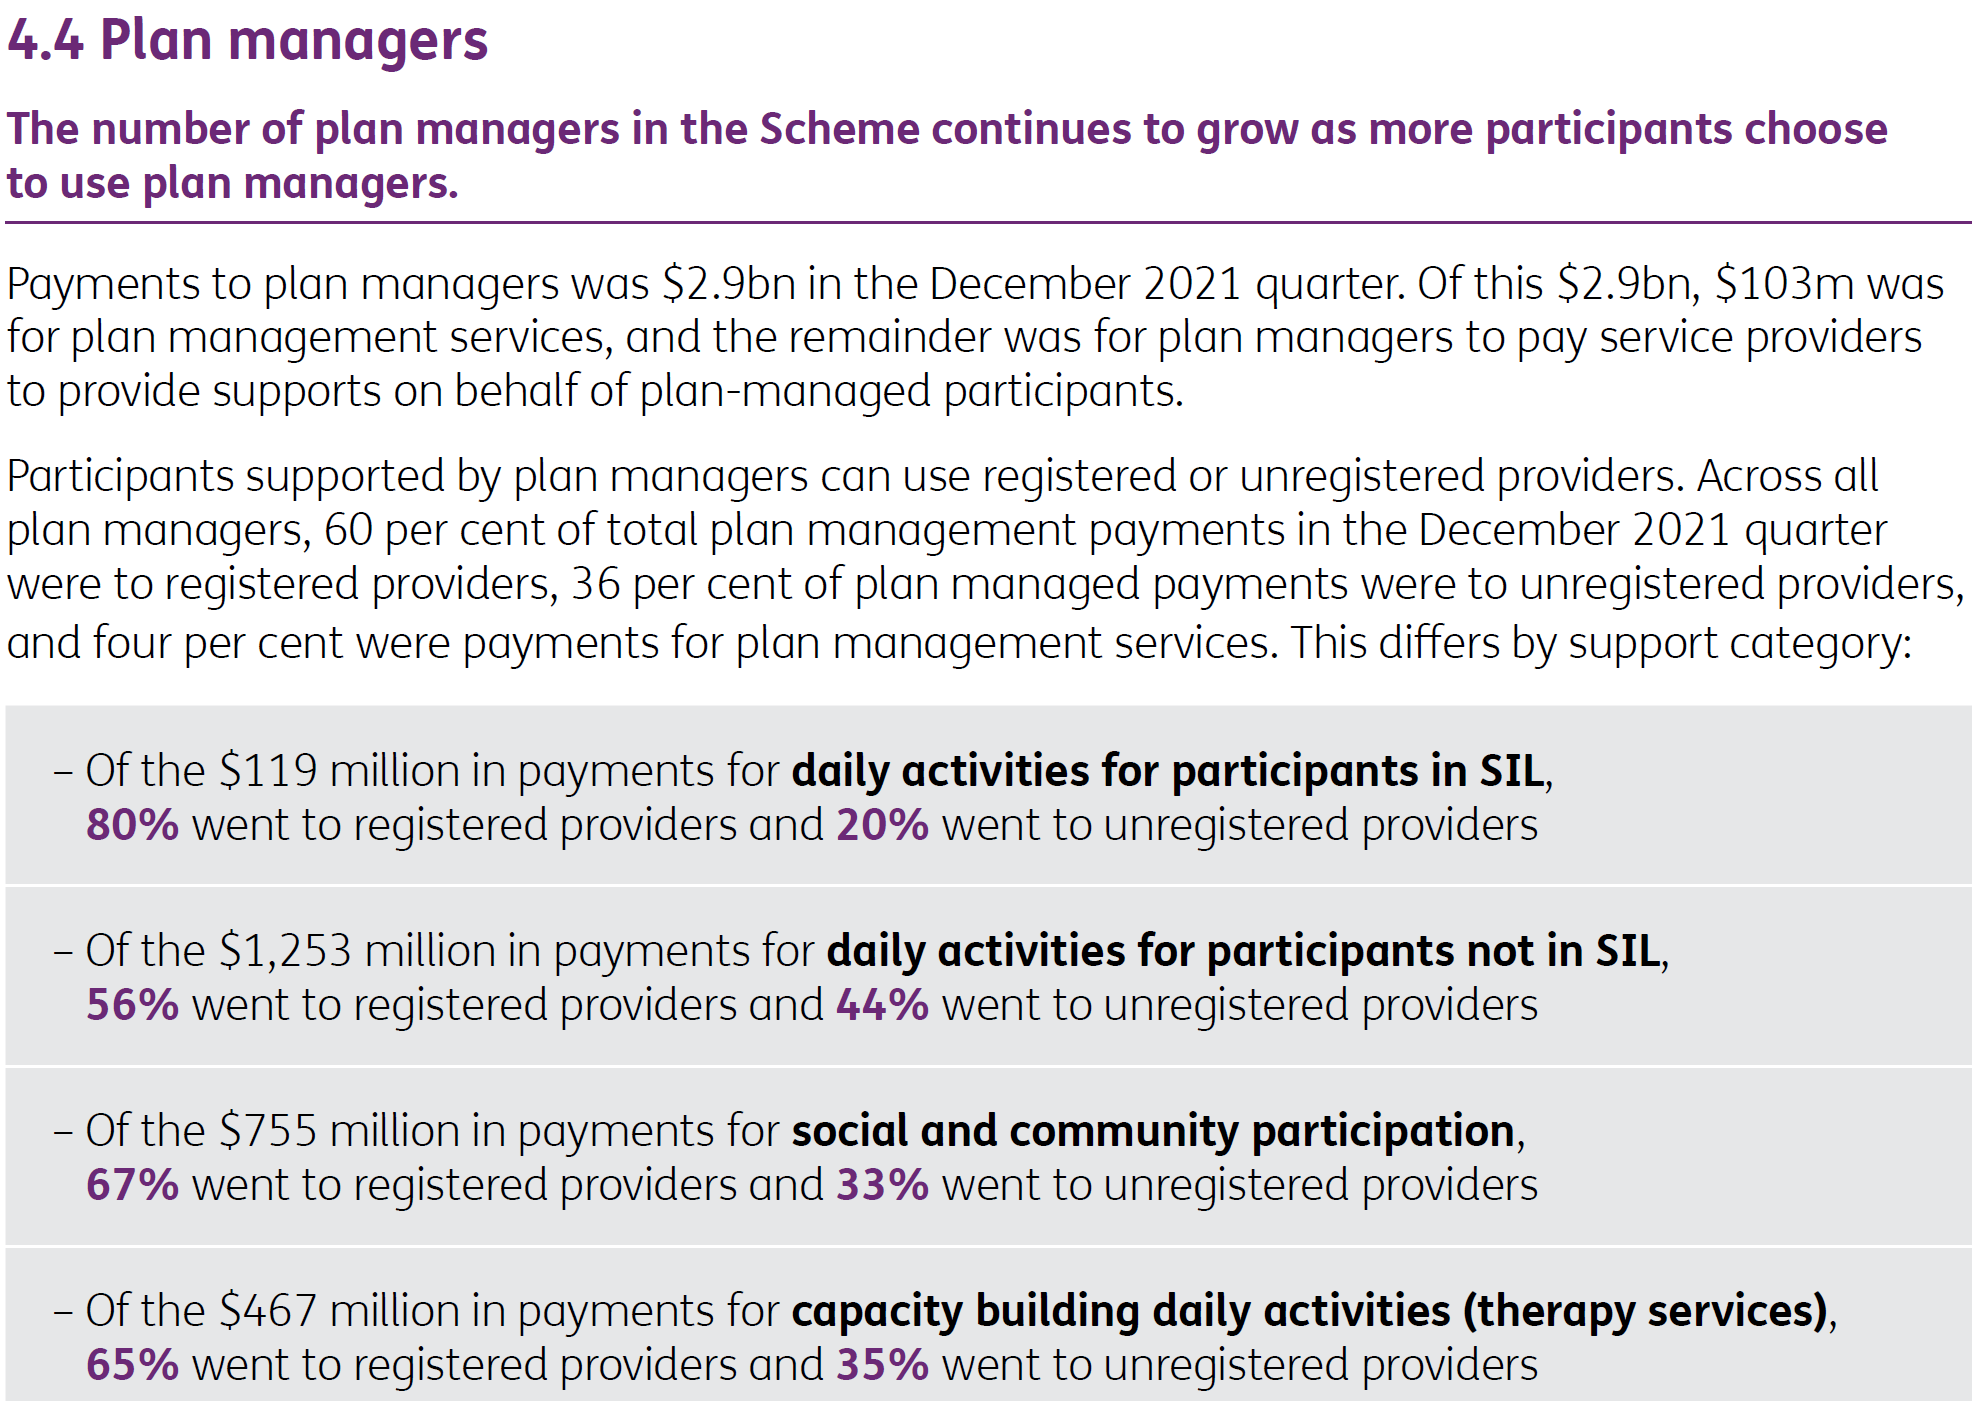
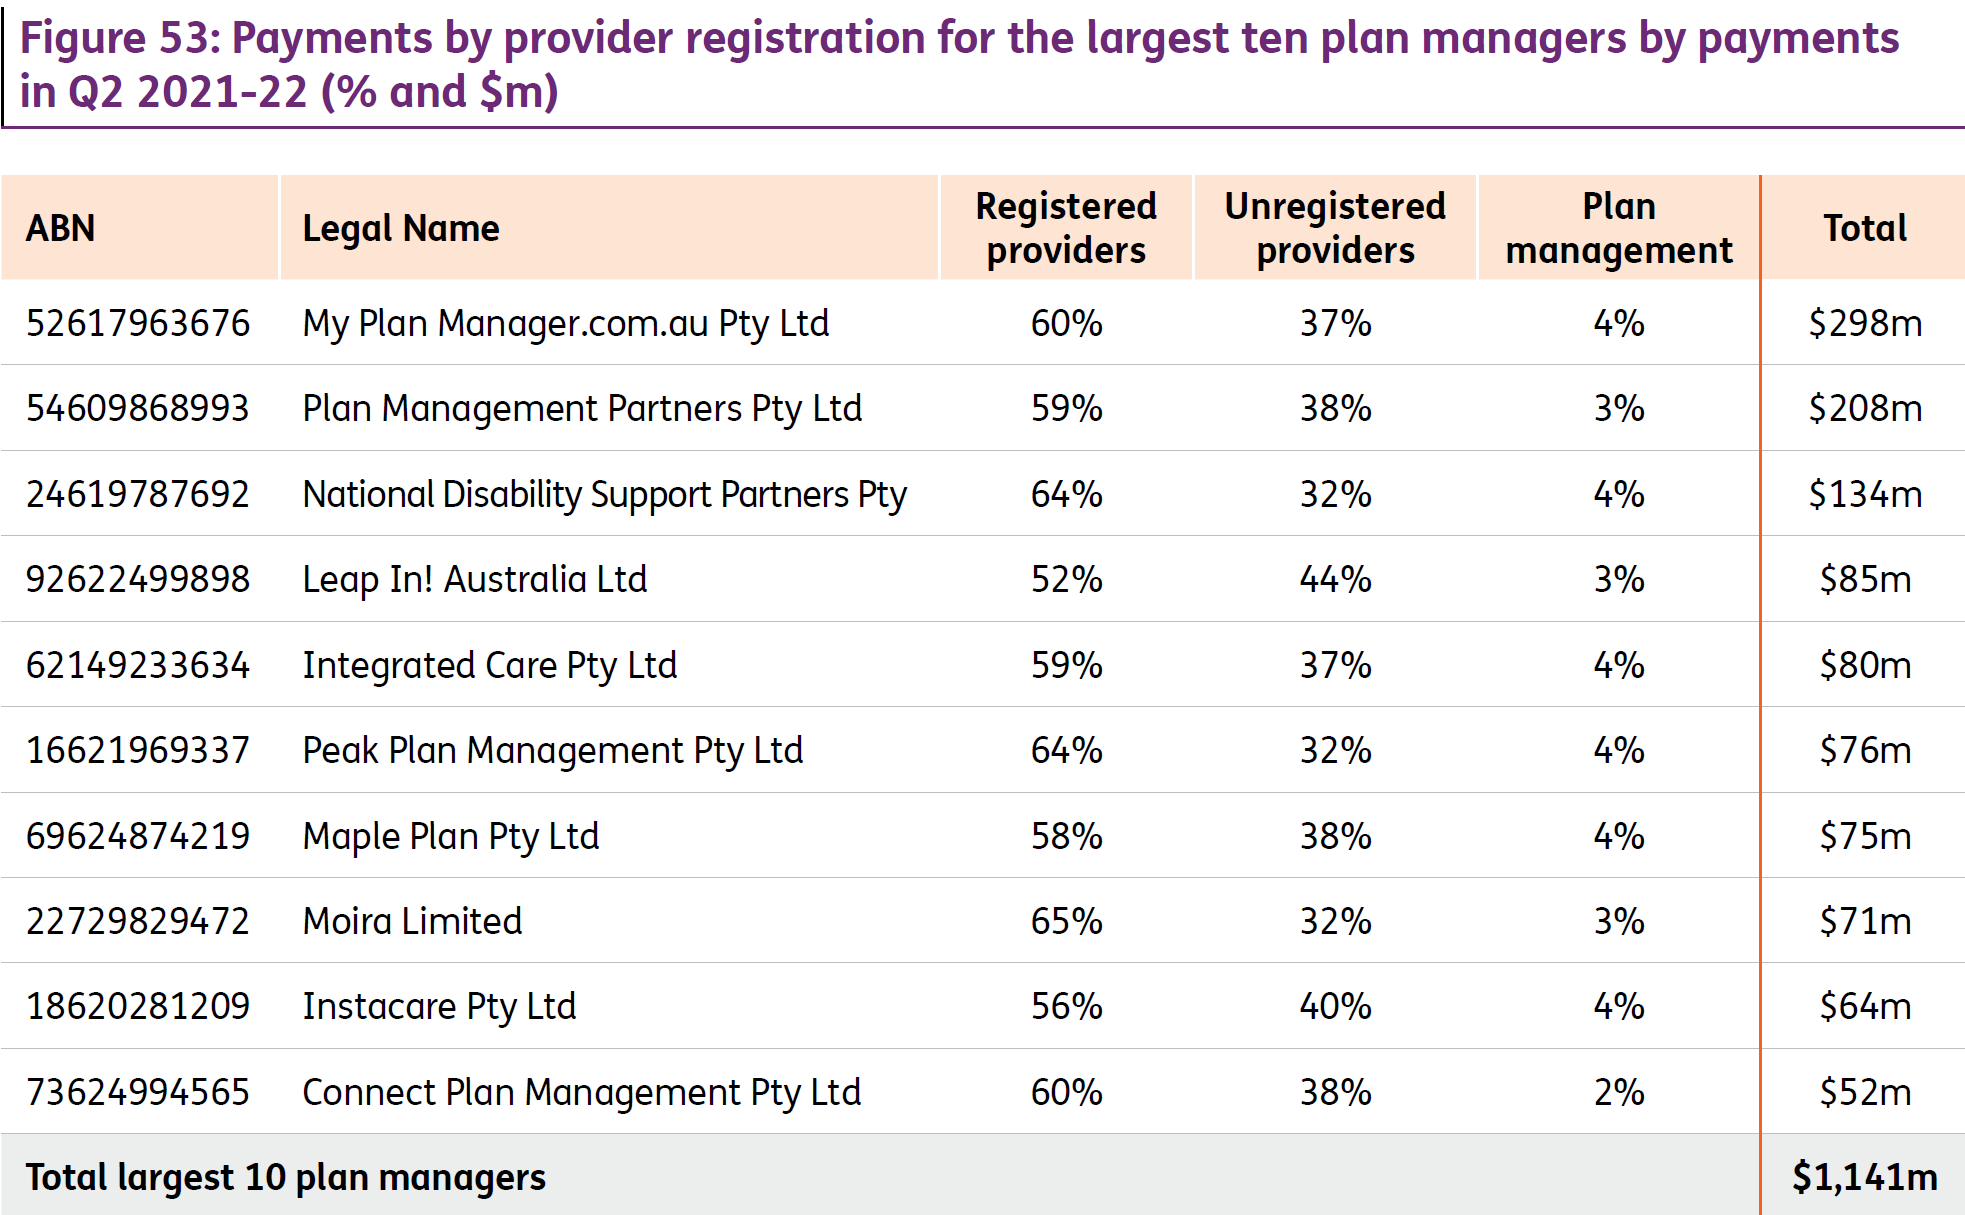
- The NDIA have published data on the top ten Plan Management providers by value of claims with the overwhelming majority being members of DIA.
- Claims by the top ten Plan Managers has been further broken down to show payments to registered, unregistered and to plan management providers.
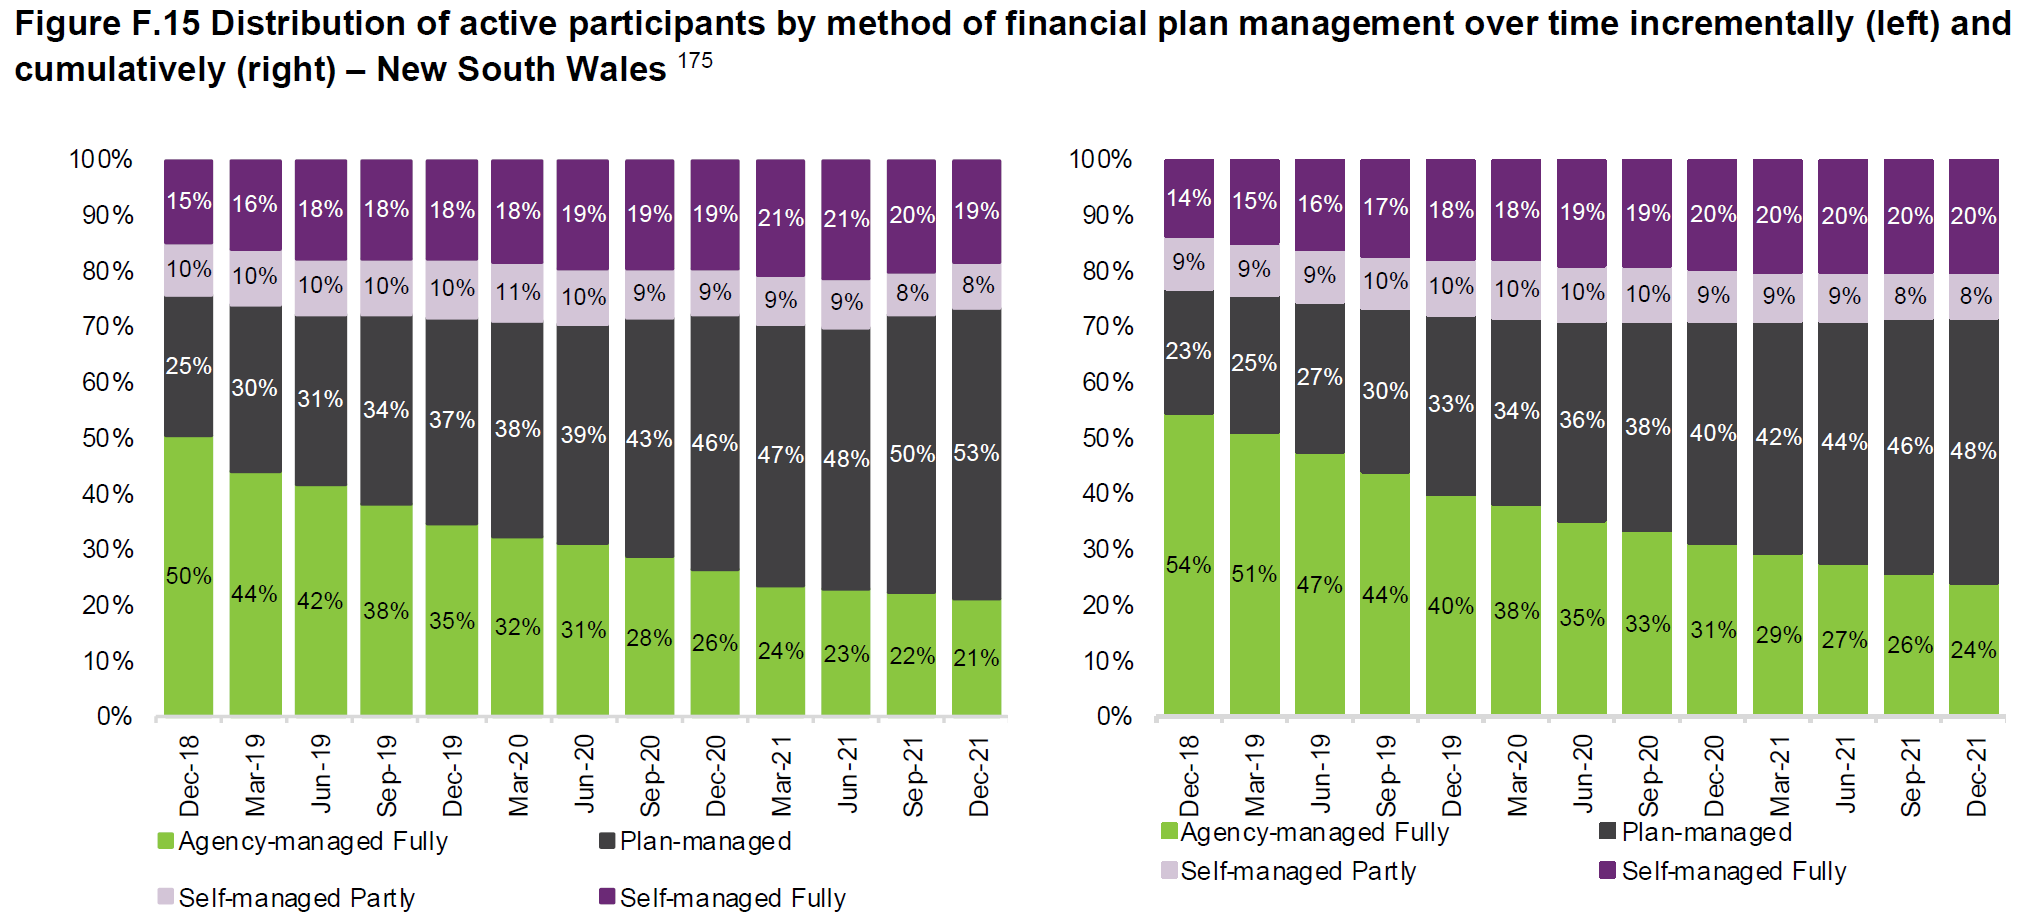
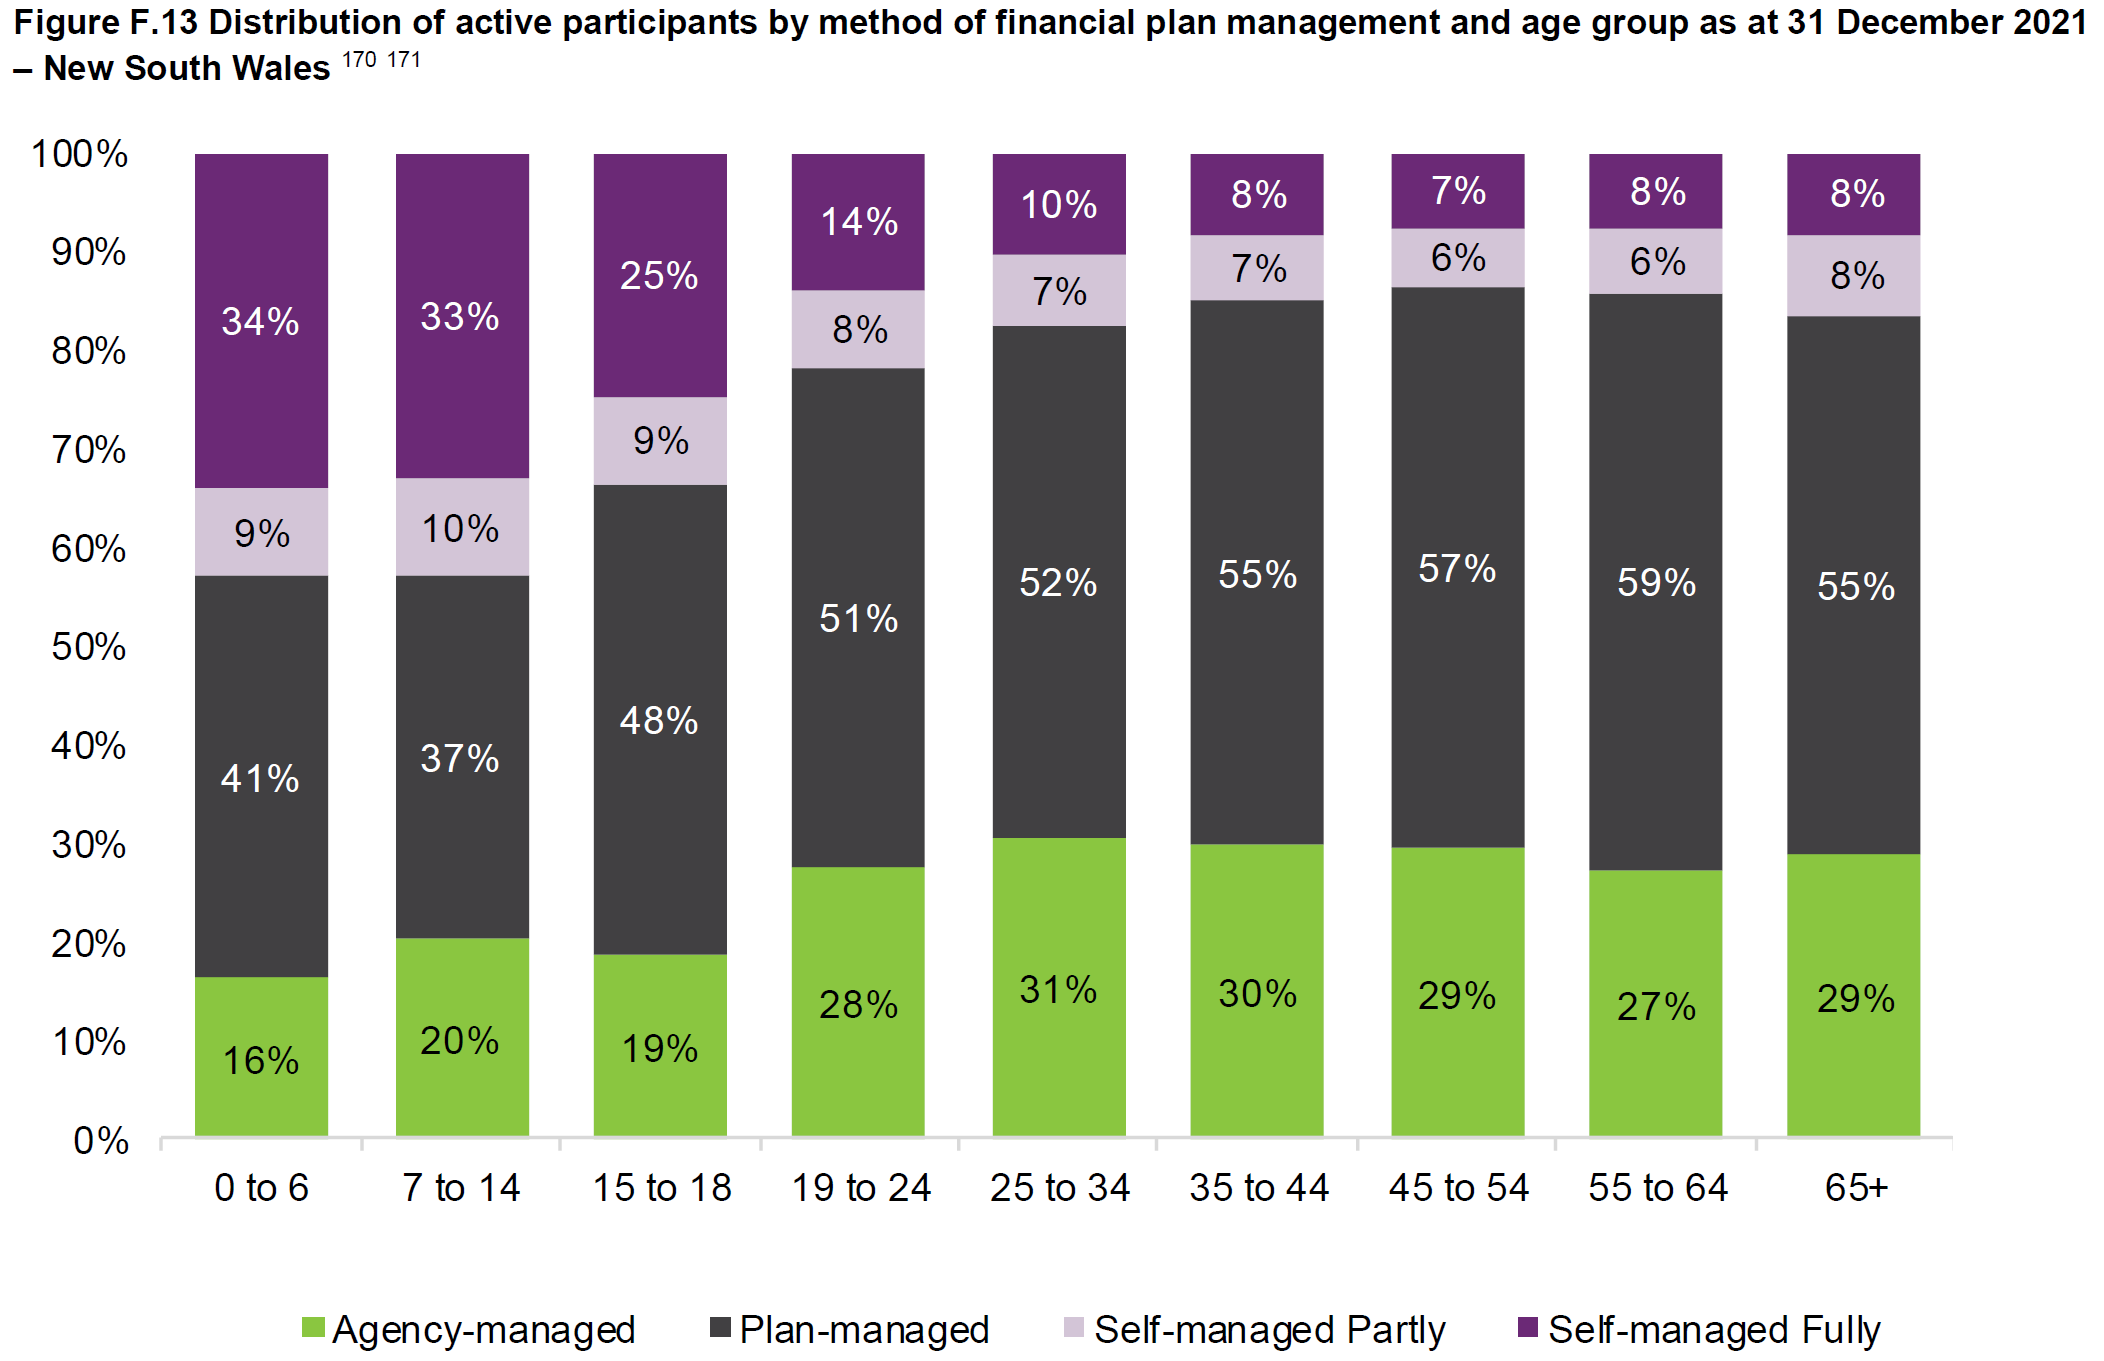
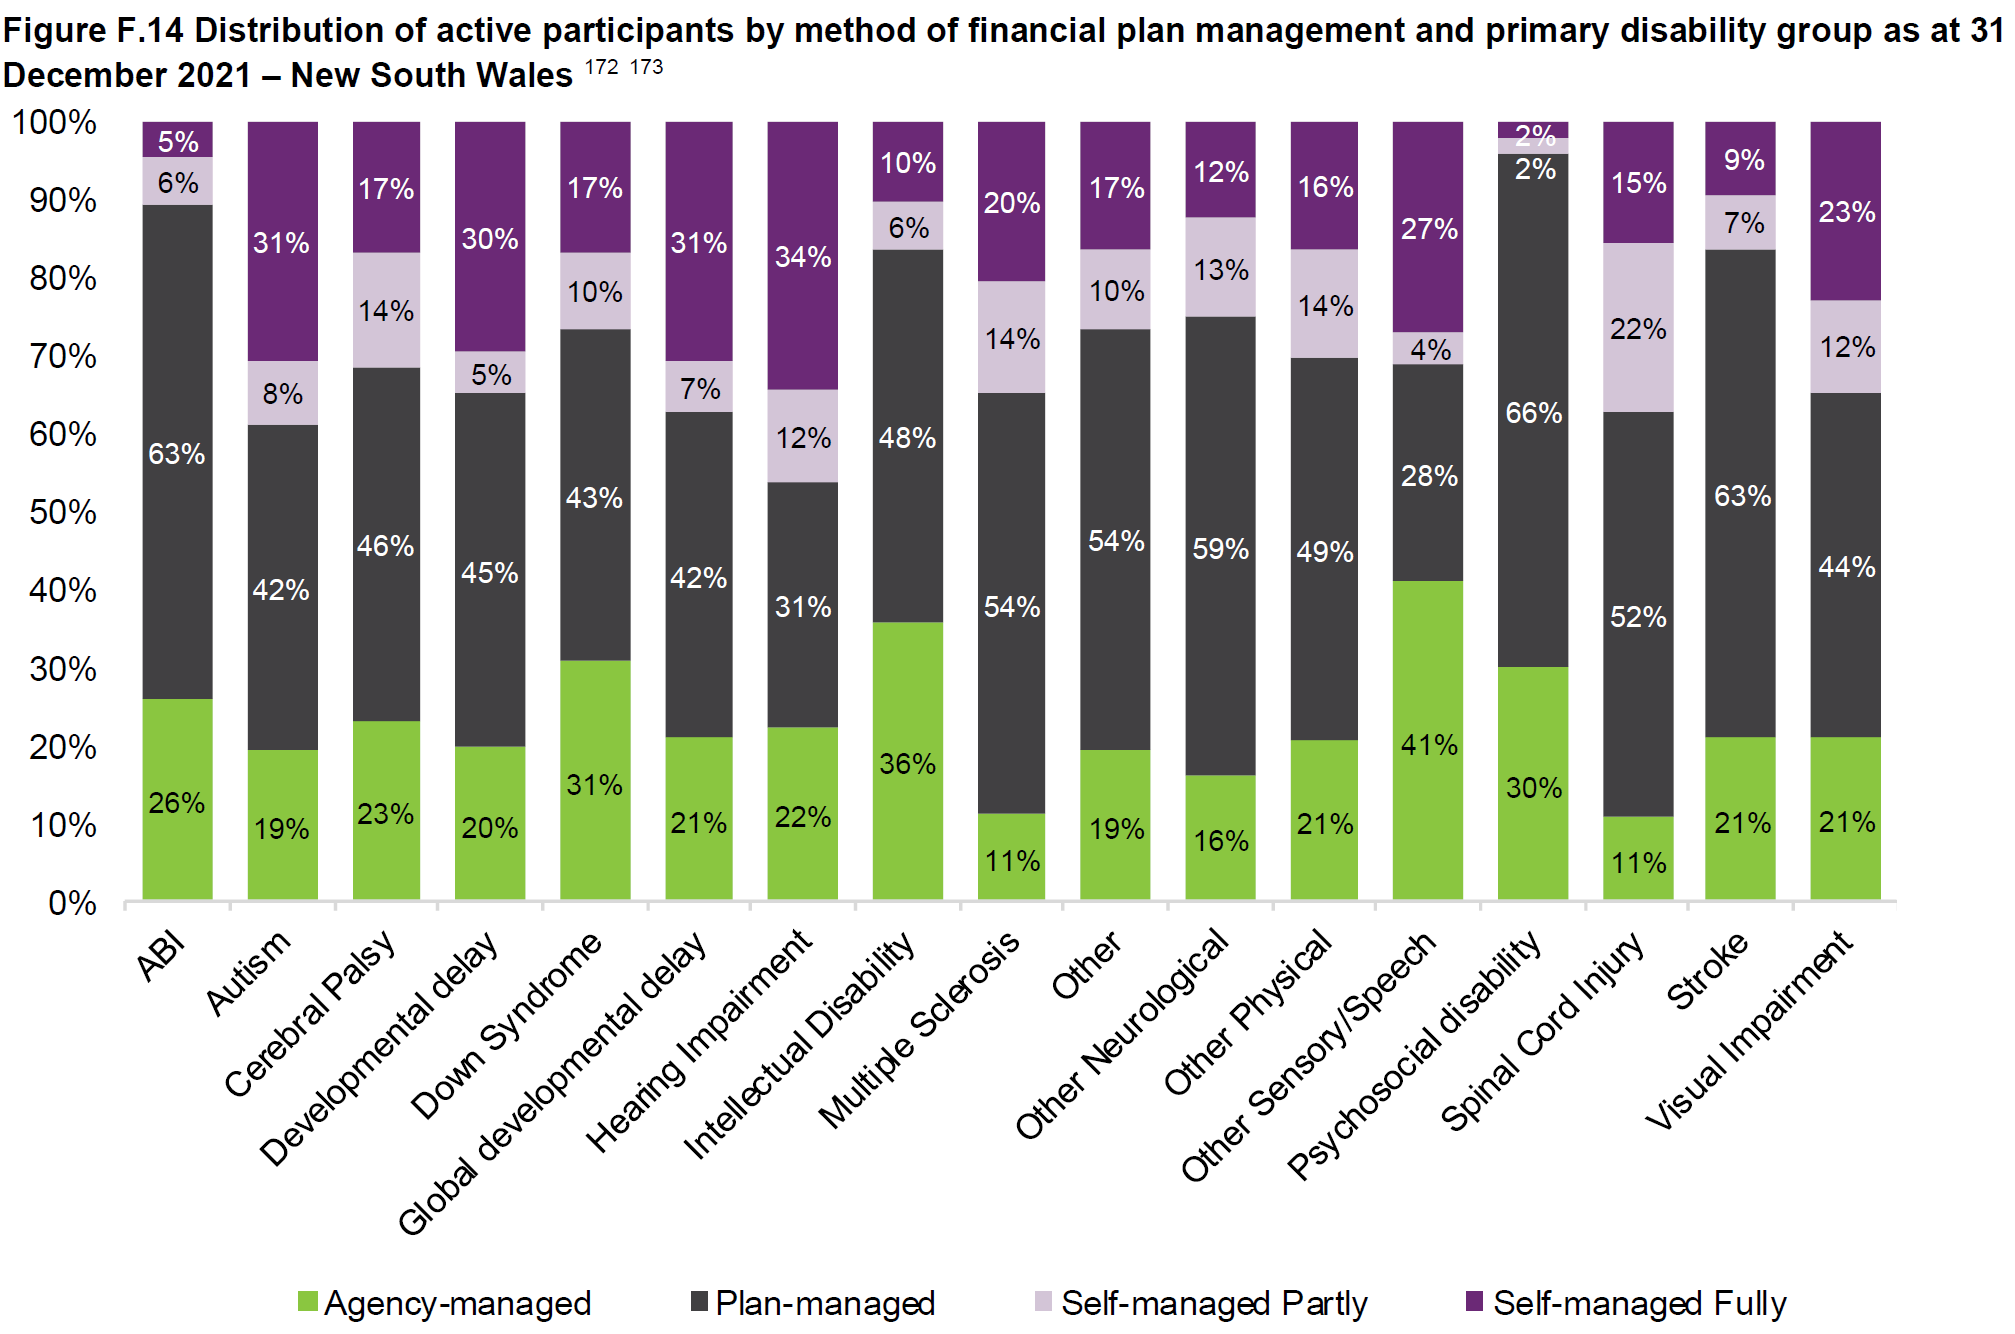
NEW SOUTH WALES - PLAN MANAGEMENT
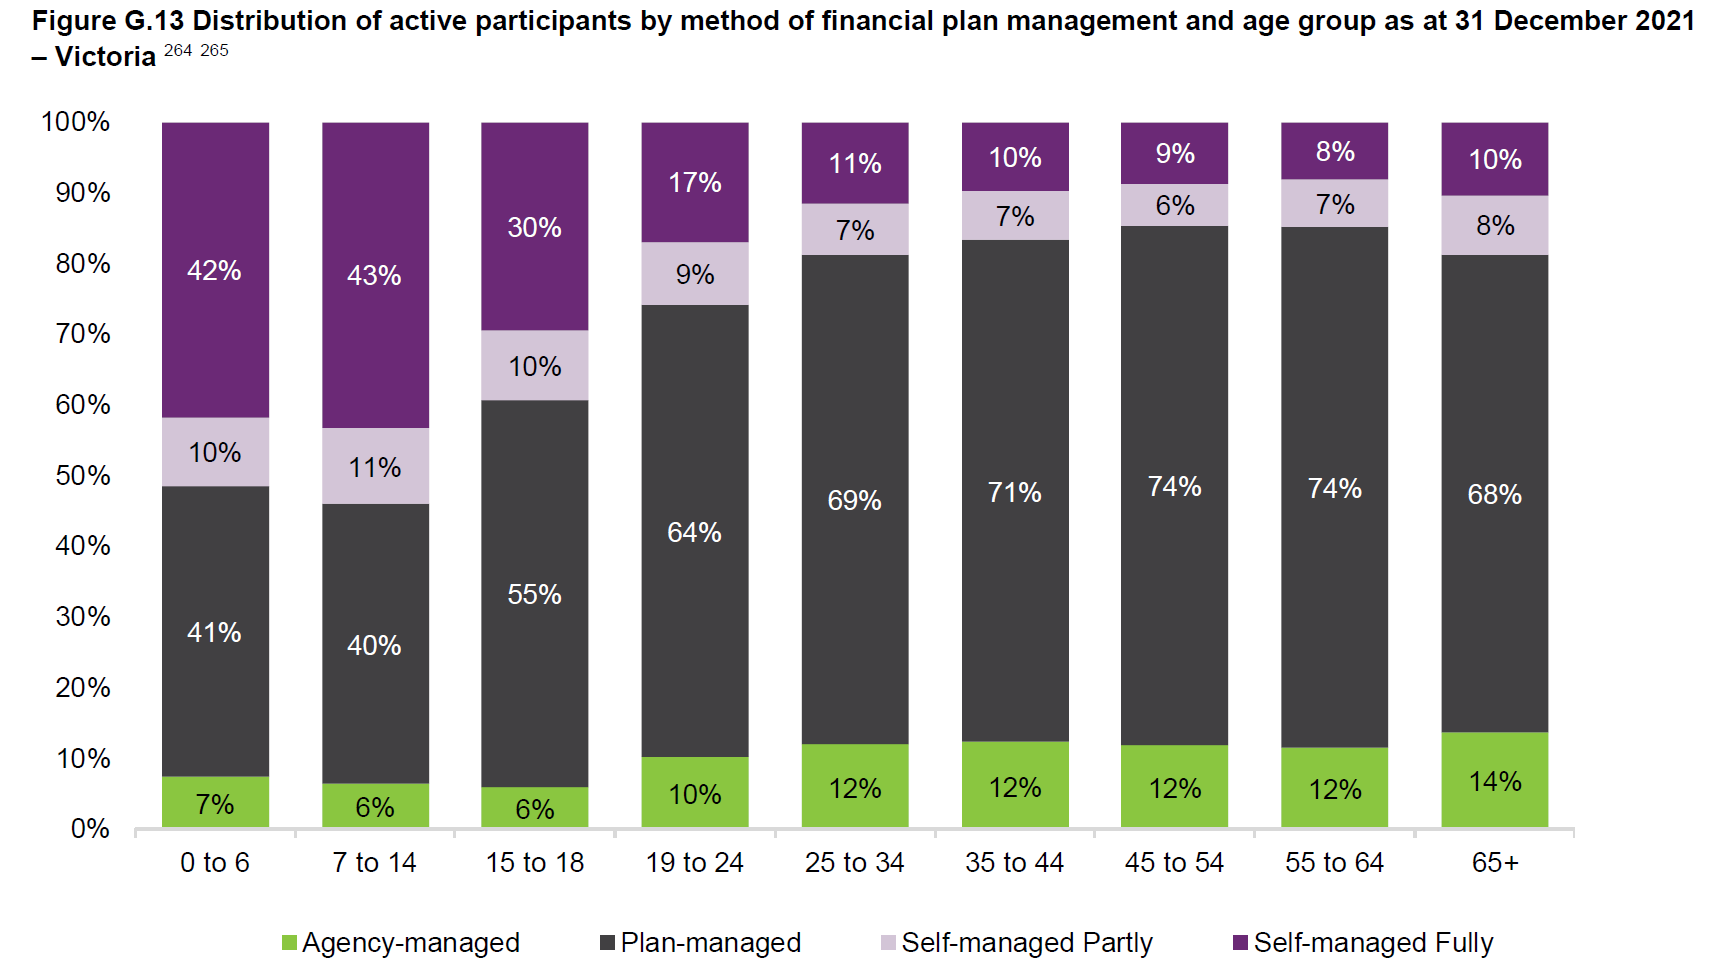
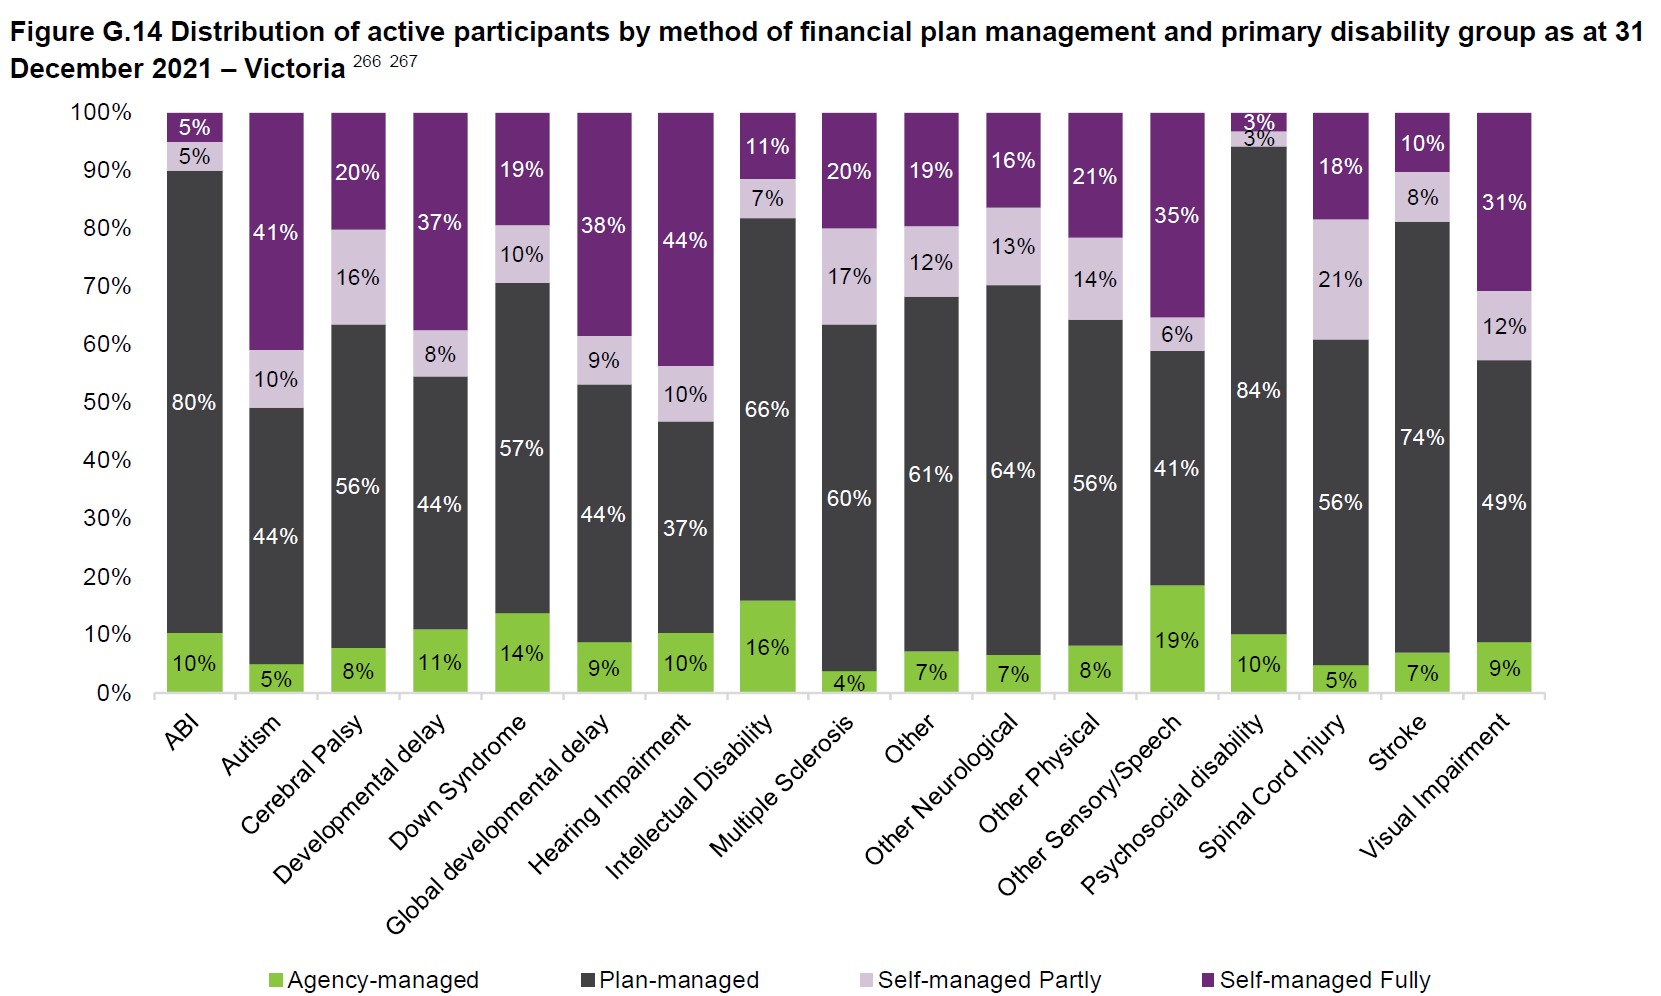
VICTORIA - PLAN MANAGEMENT
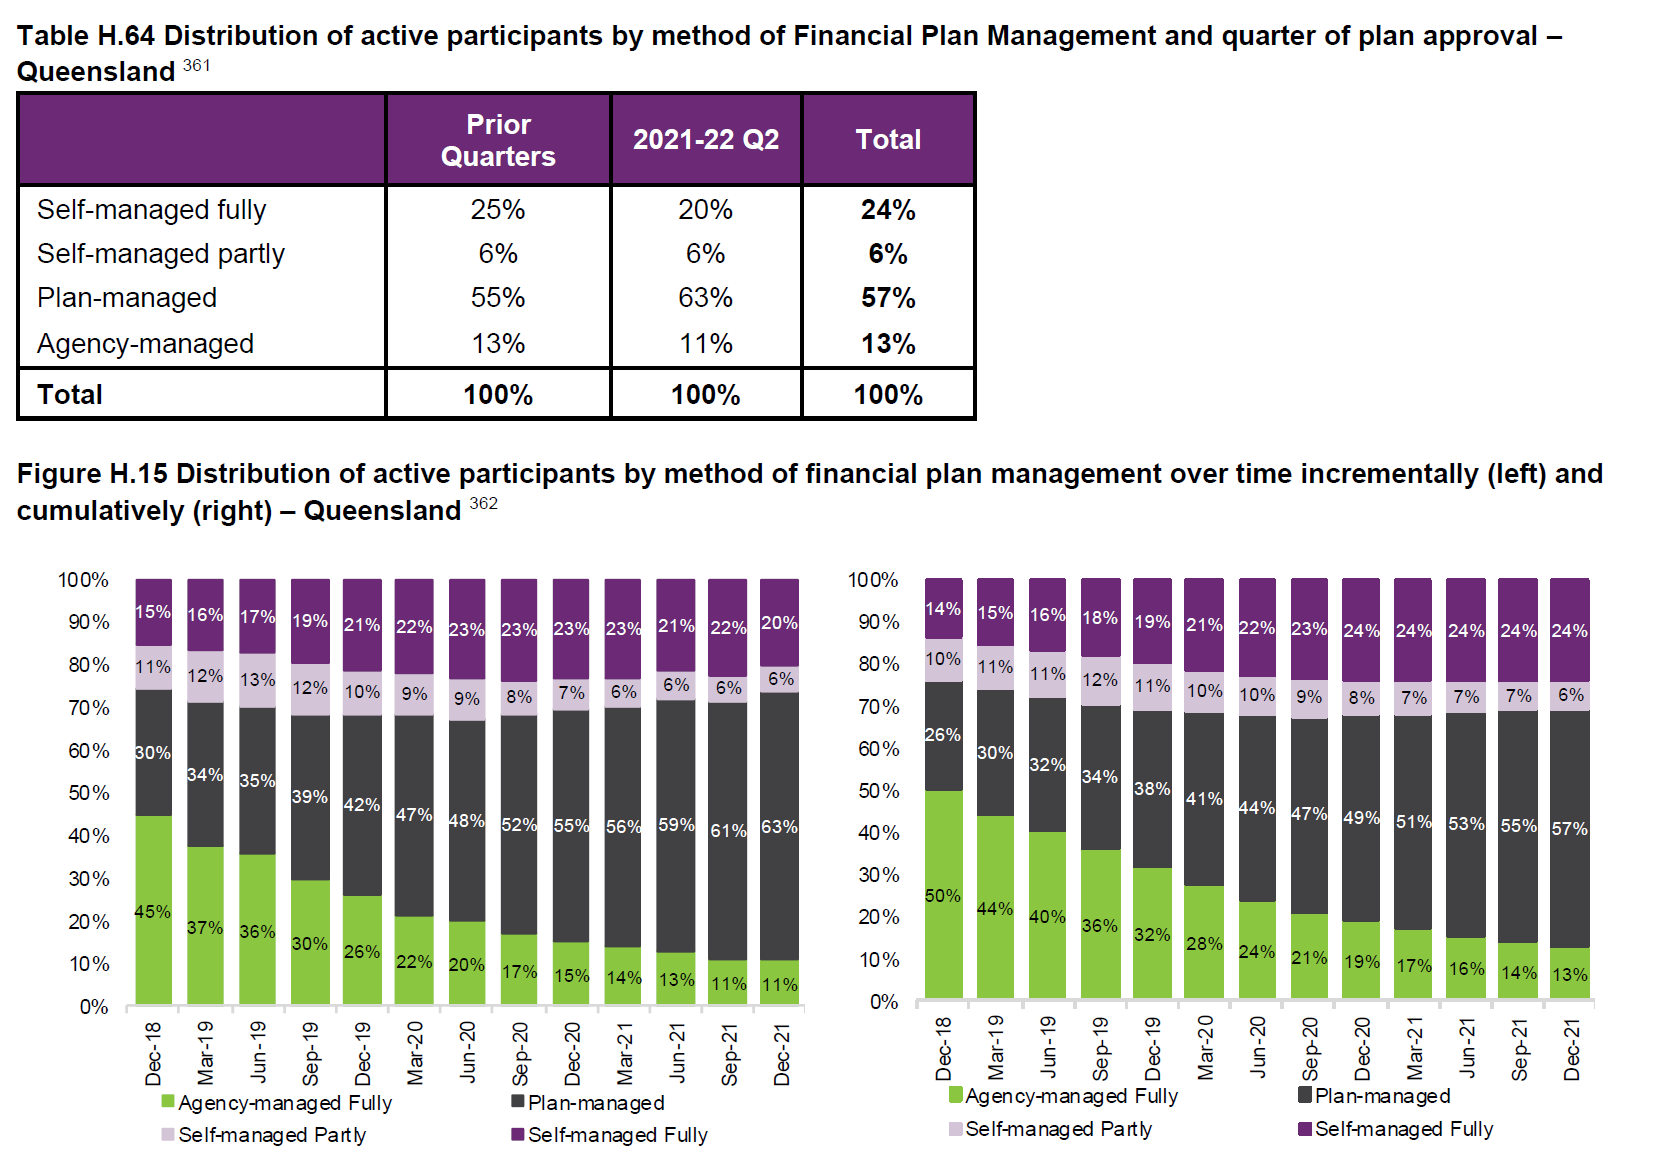
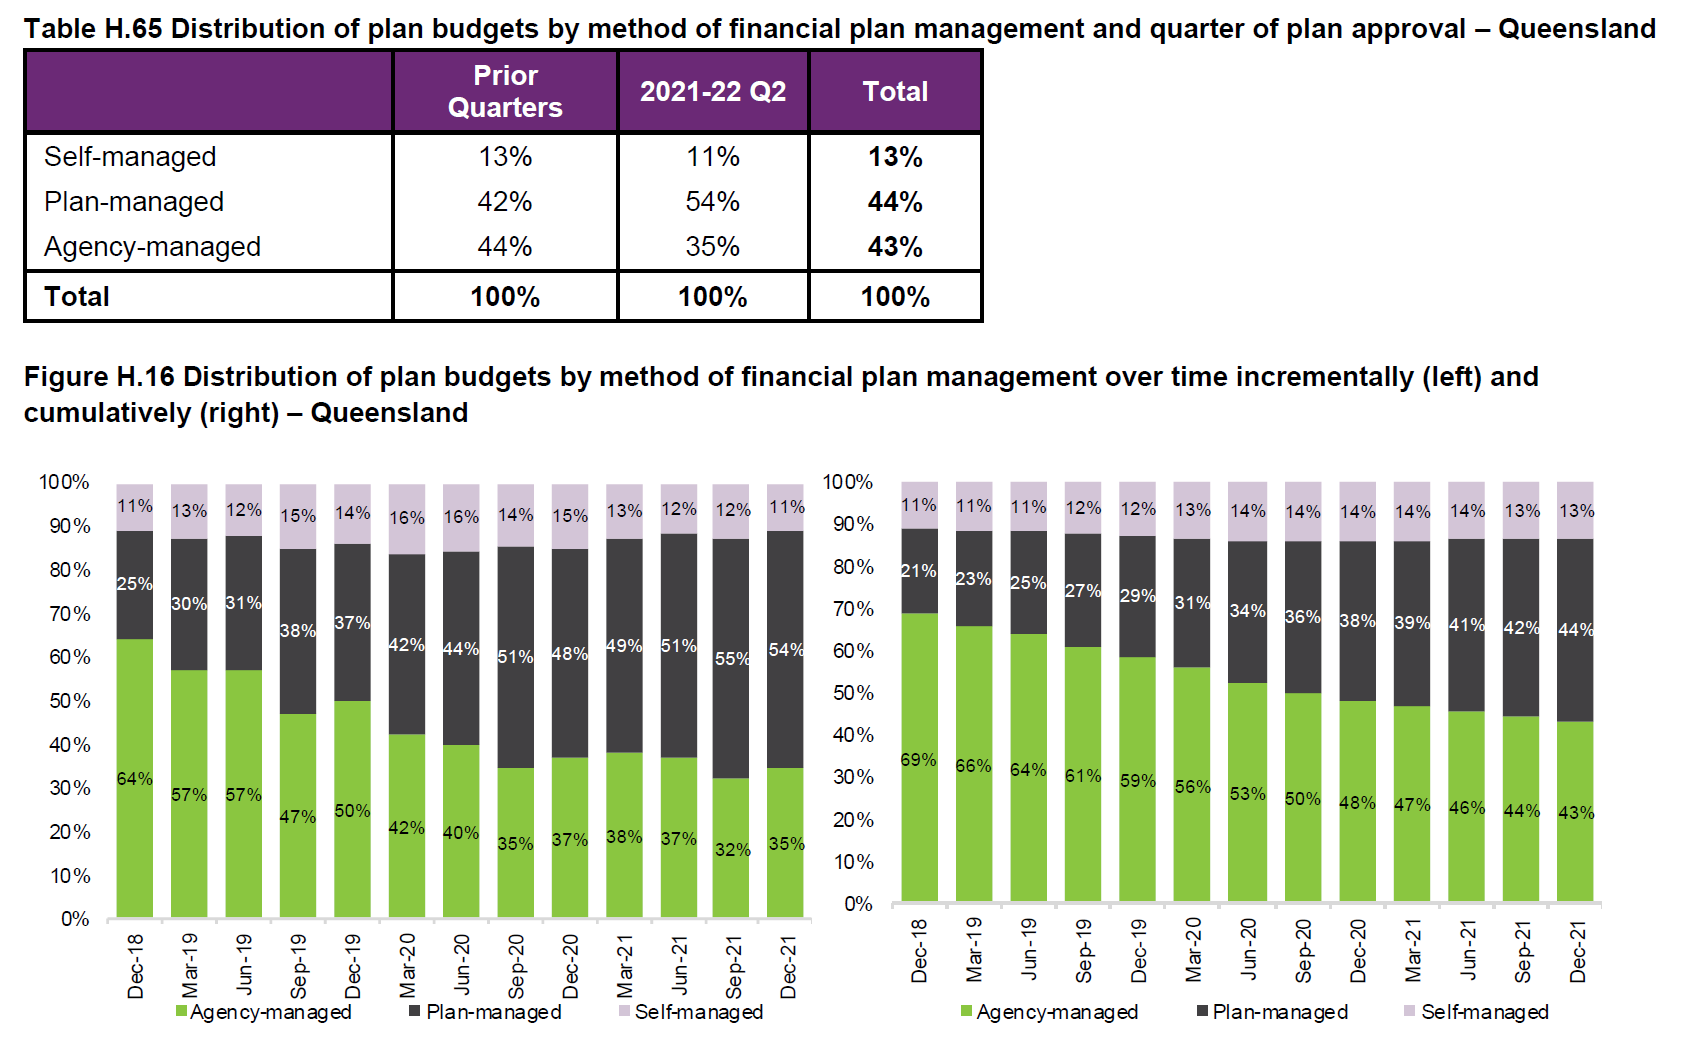
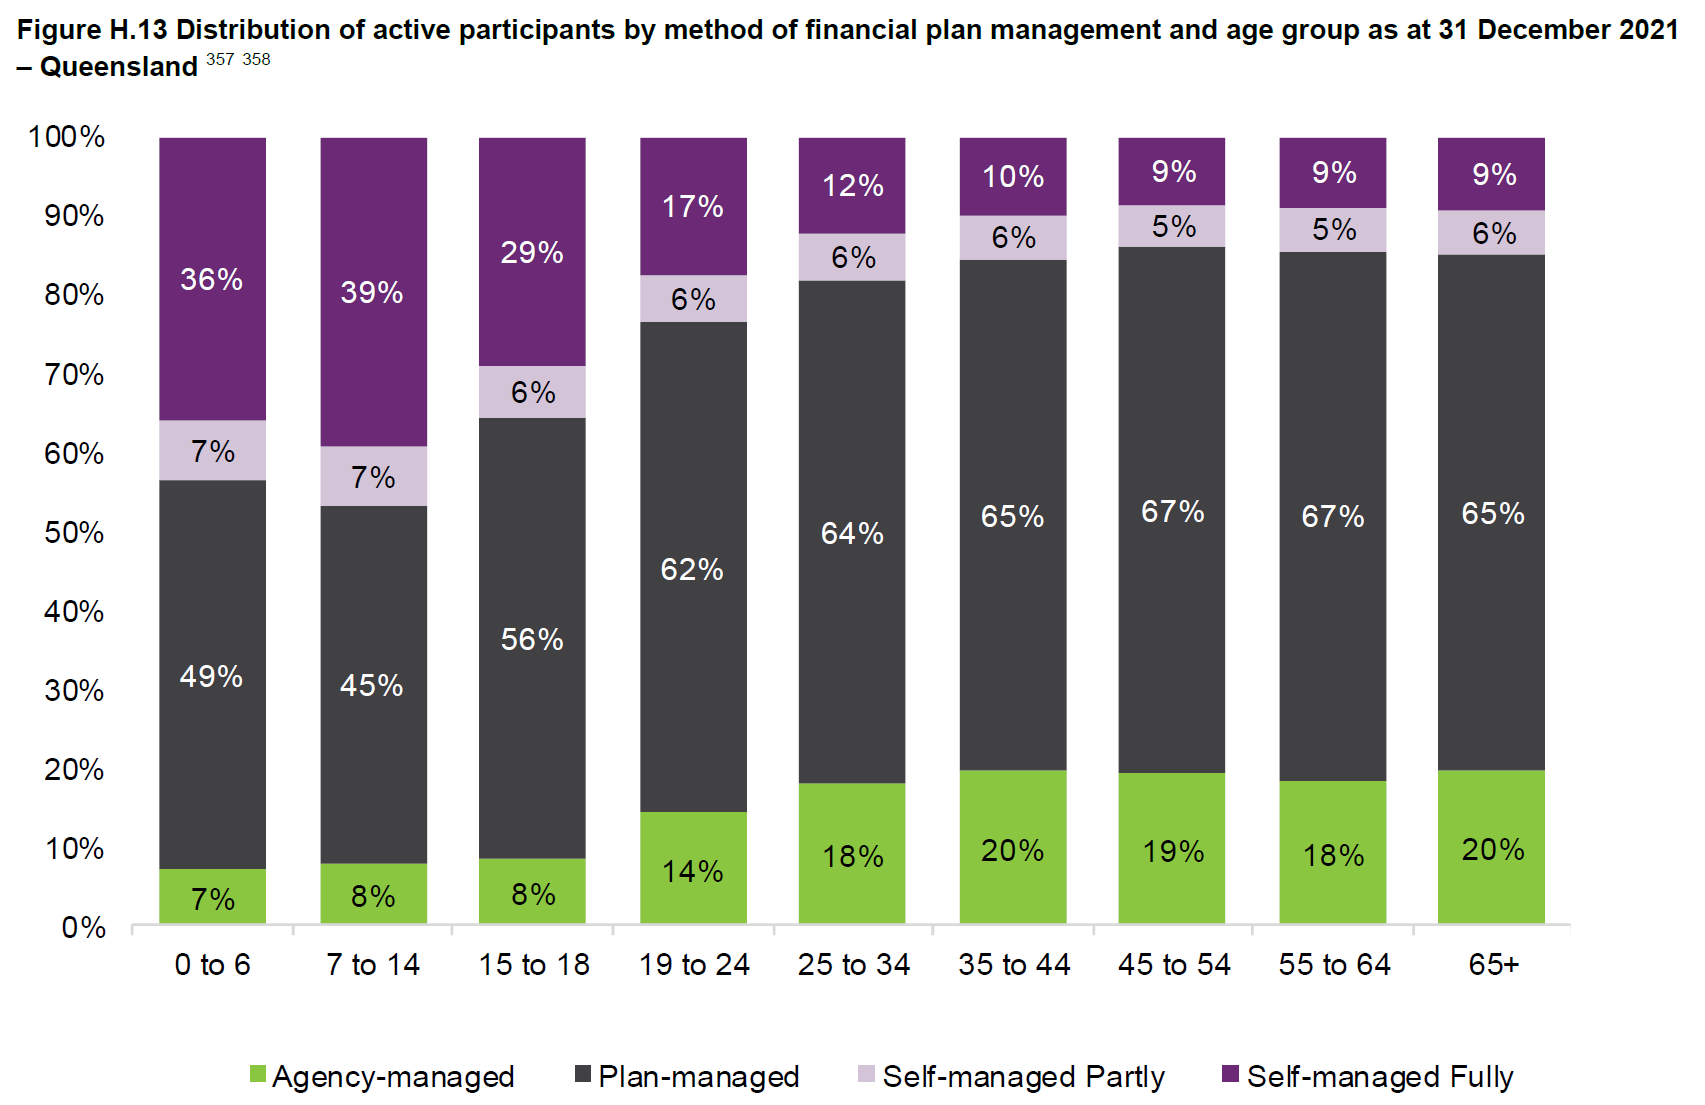
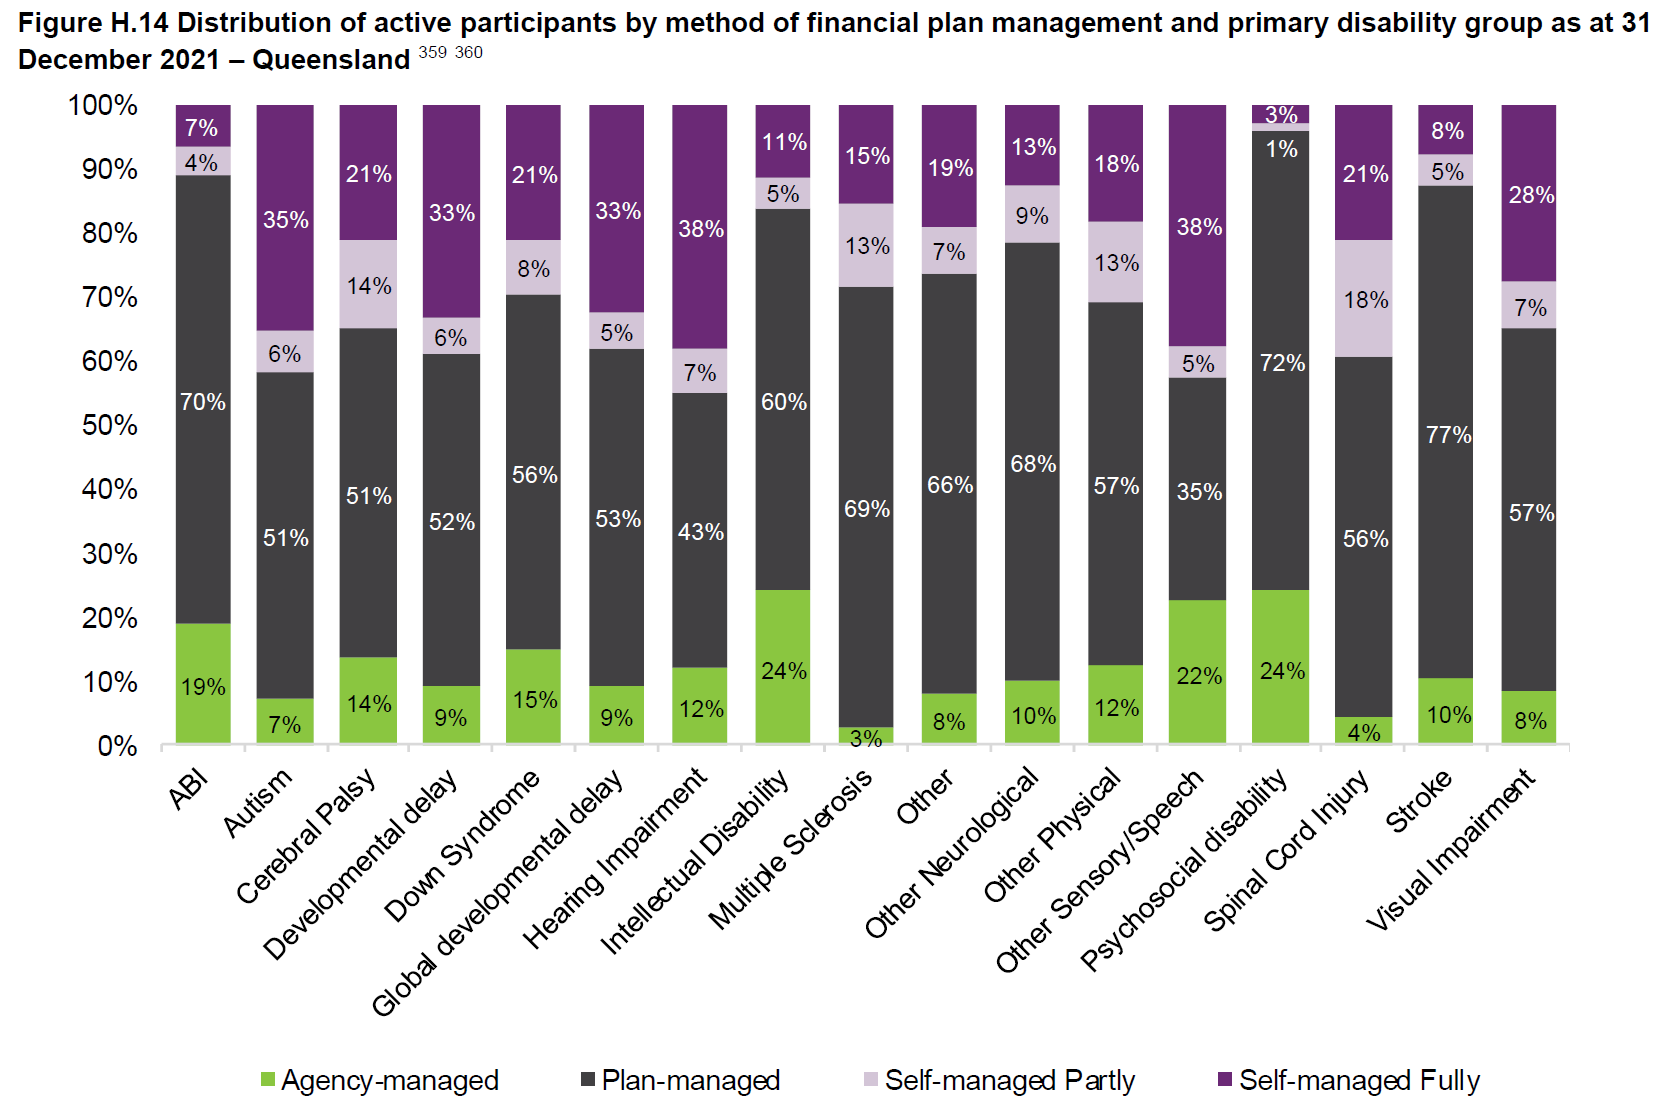
QUEENSLAND - PLAN MANAGEMENT
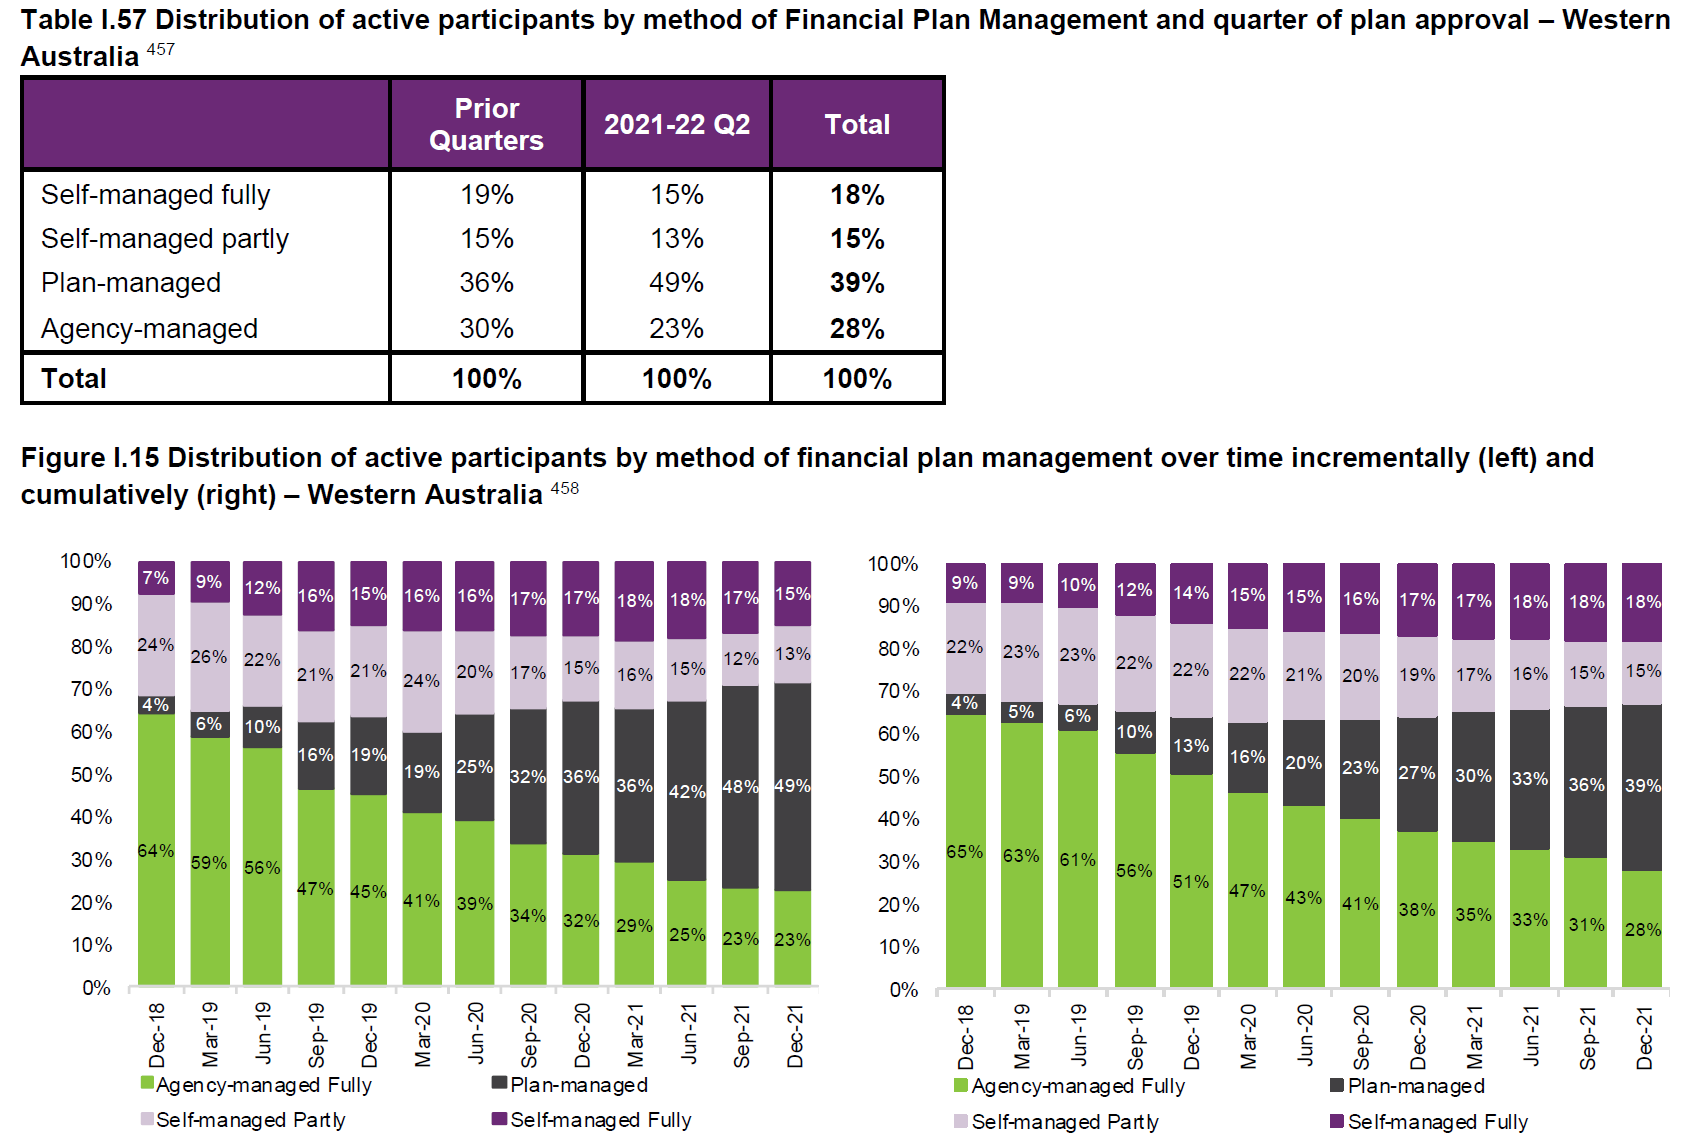
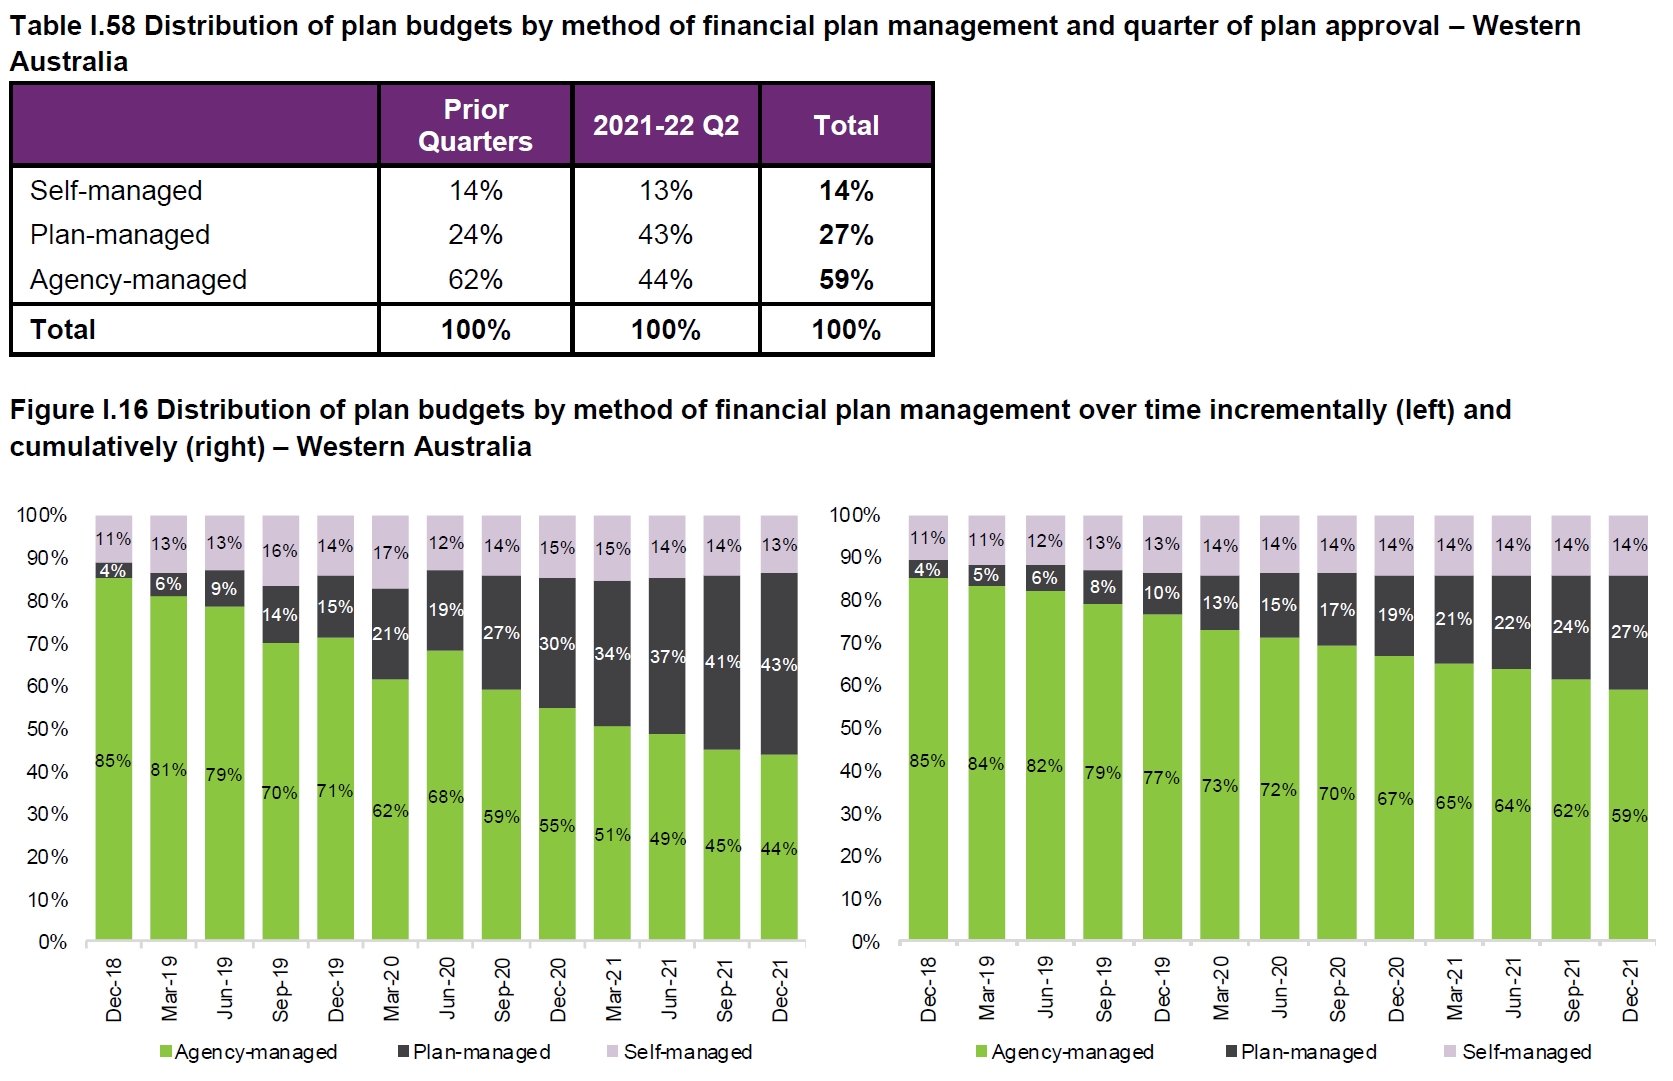
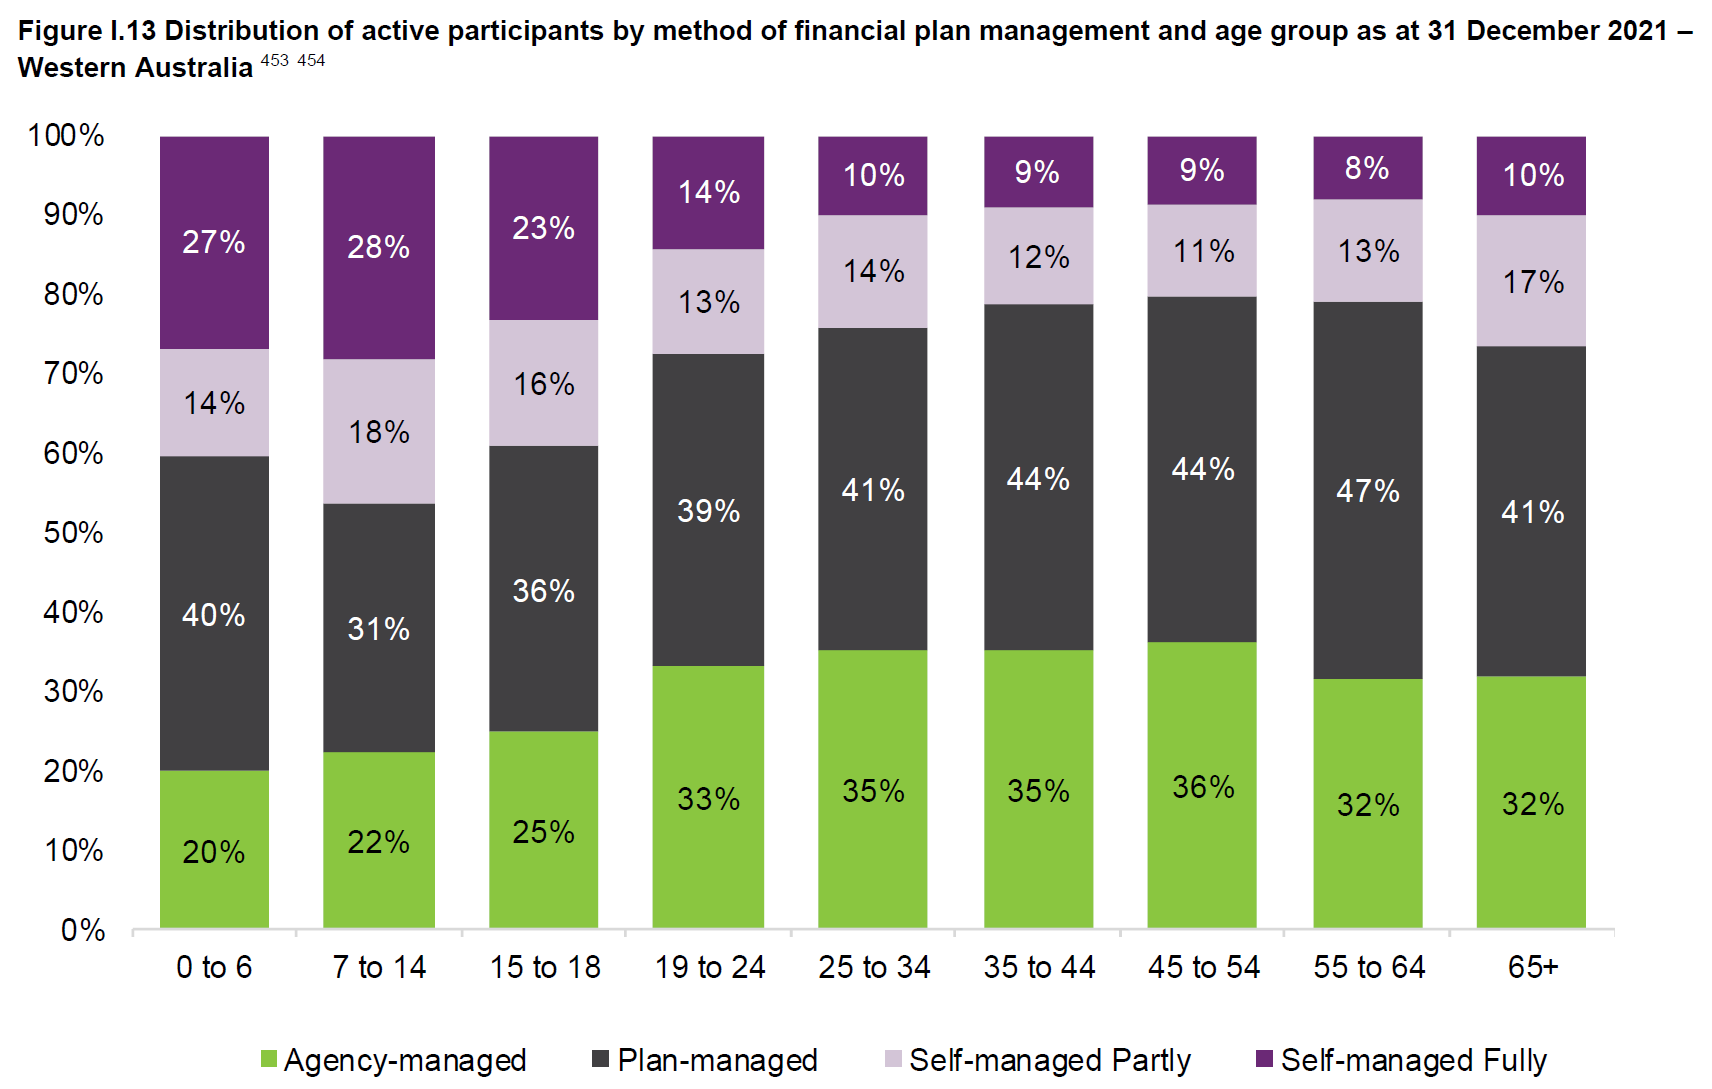
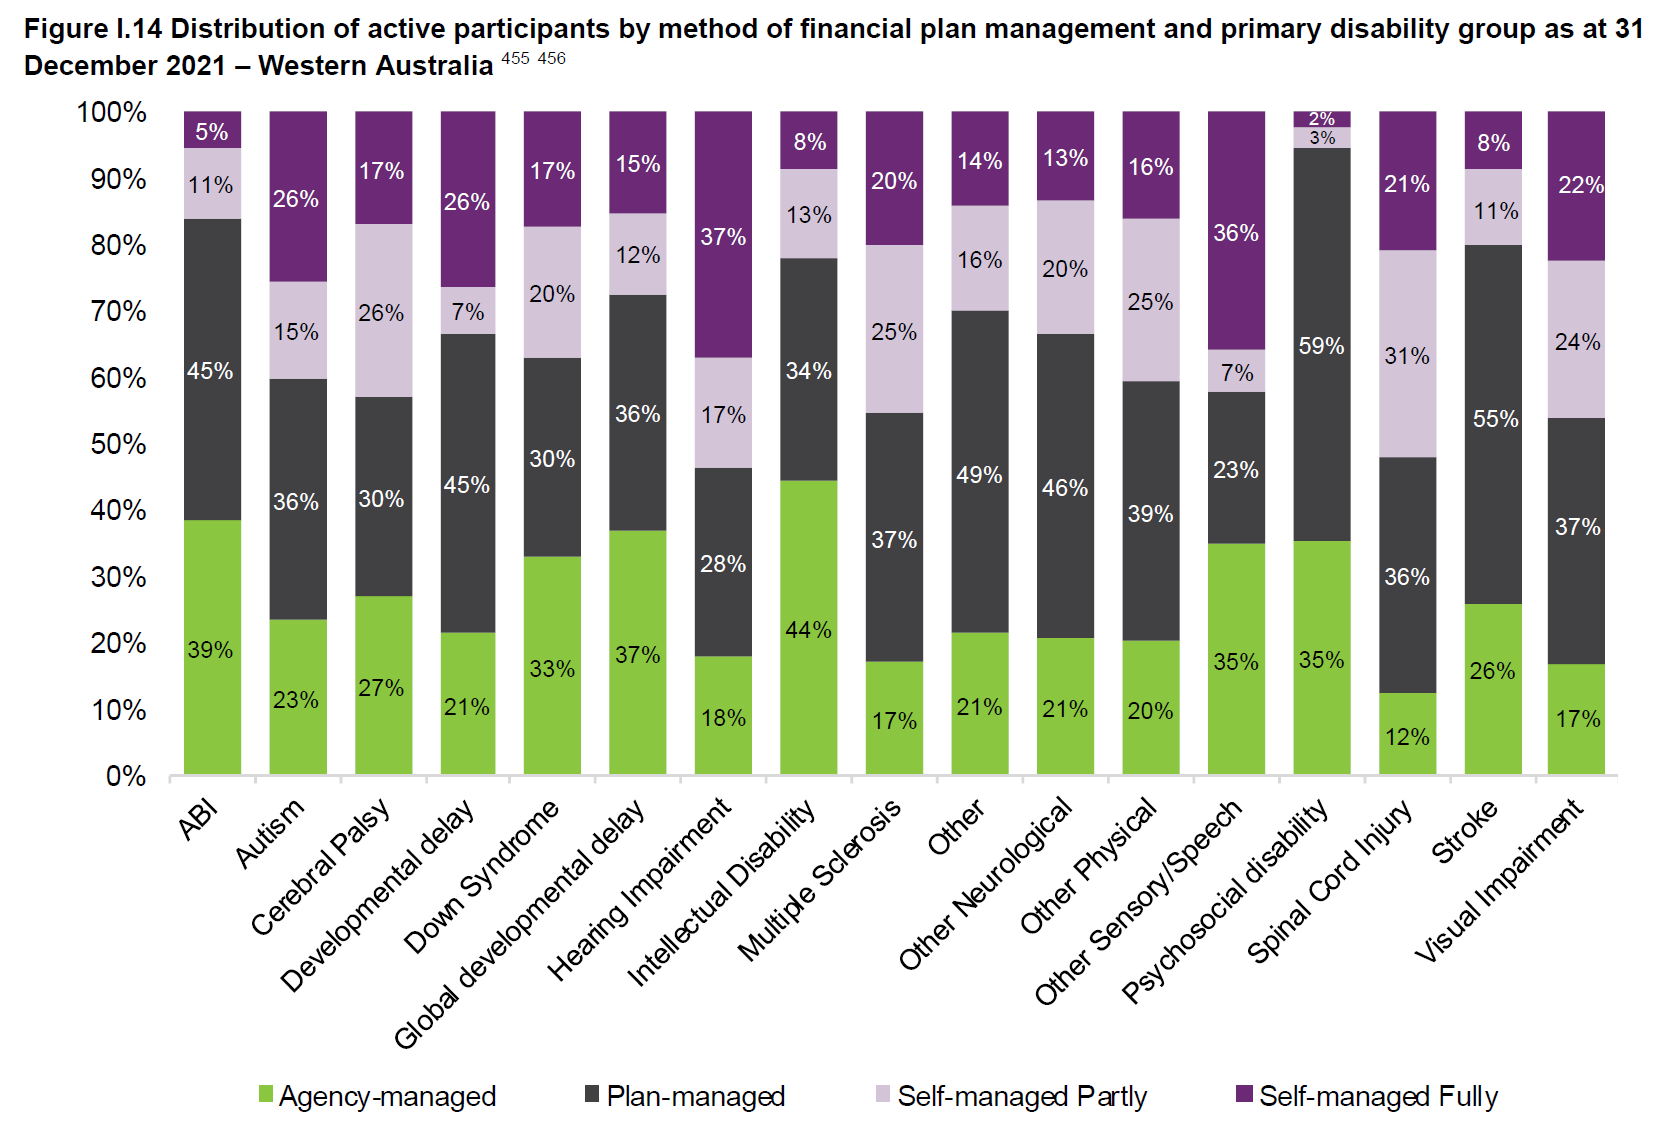
WESTERN AUSTRALIA - PLAN MANAGEMENT
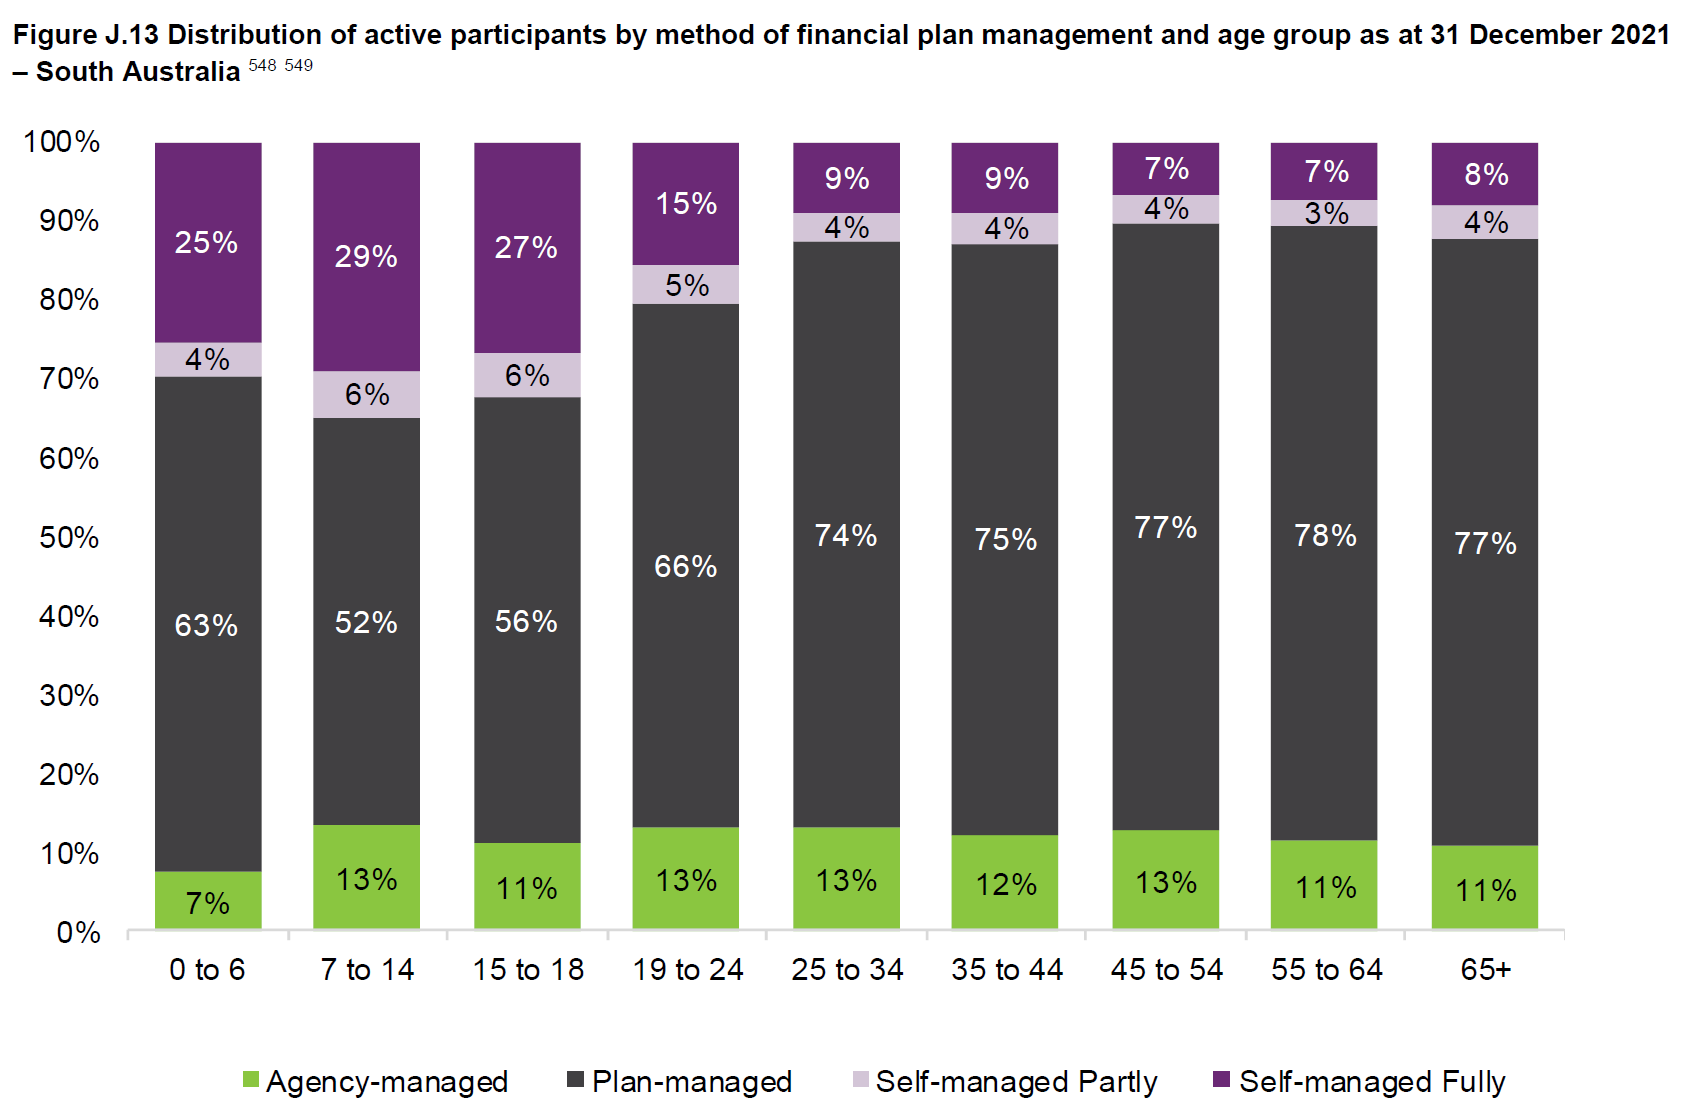
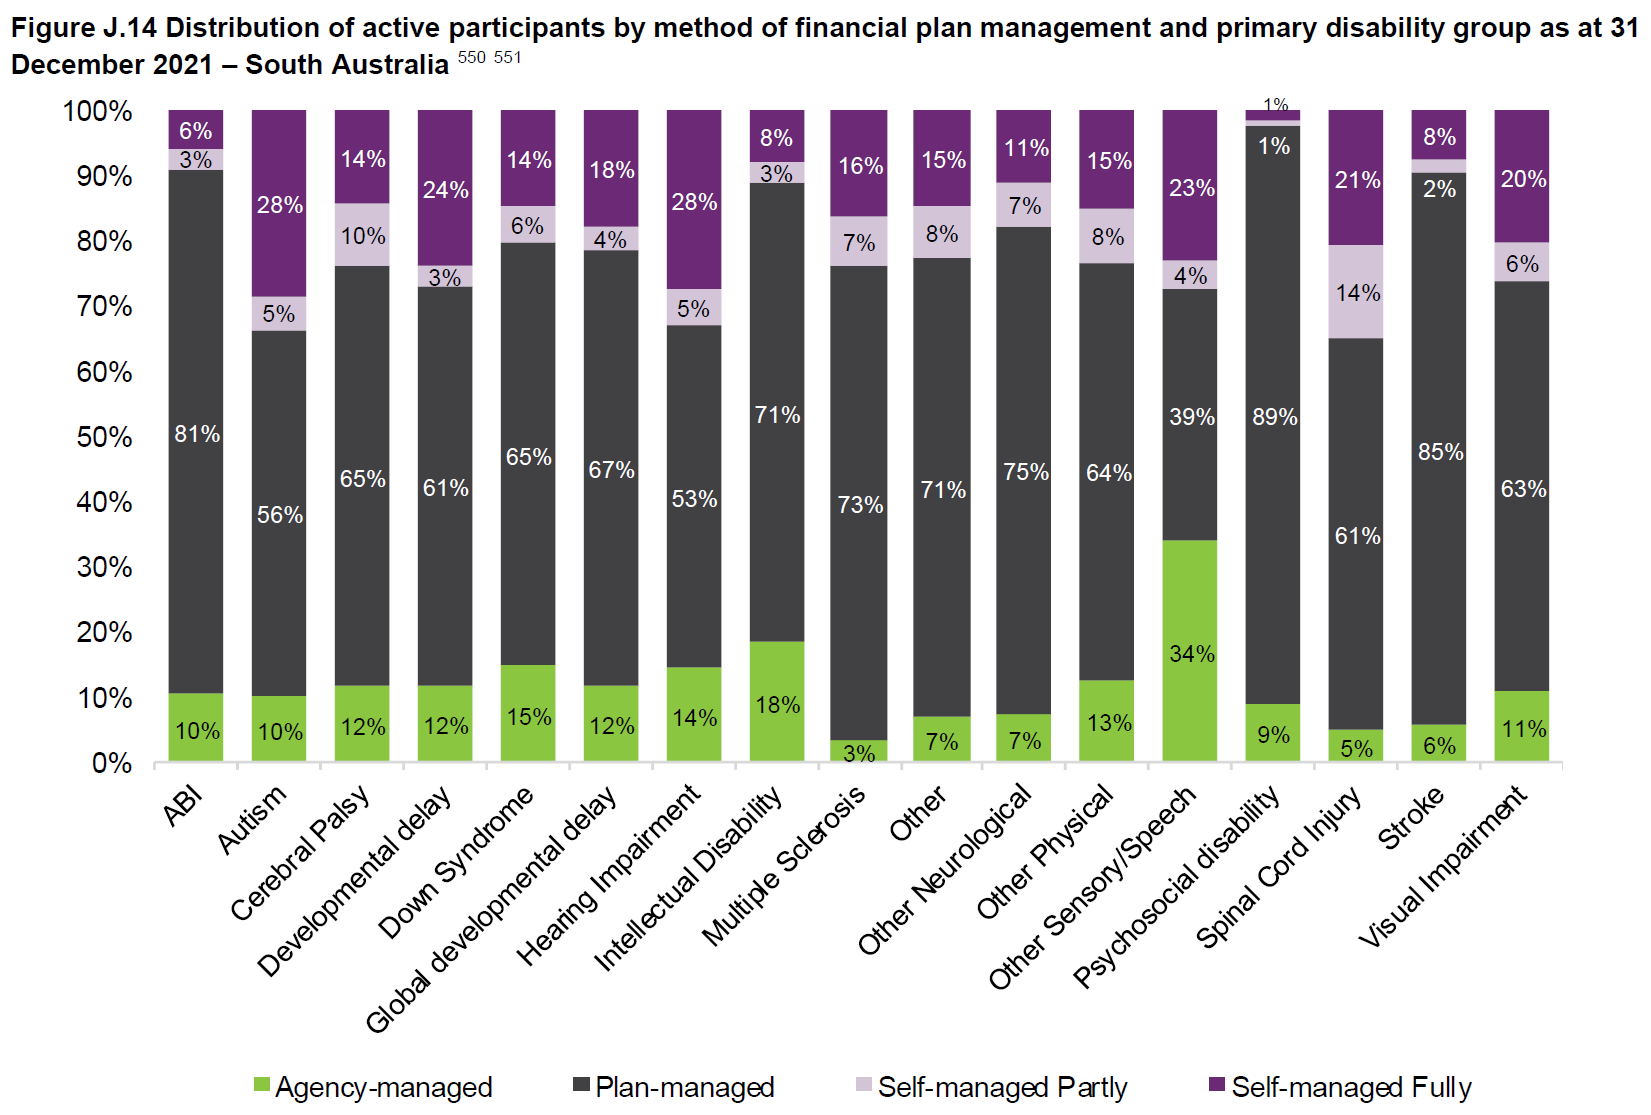
SOUTH AUSTRALIA - PLAN MANAGEMENT
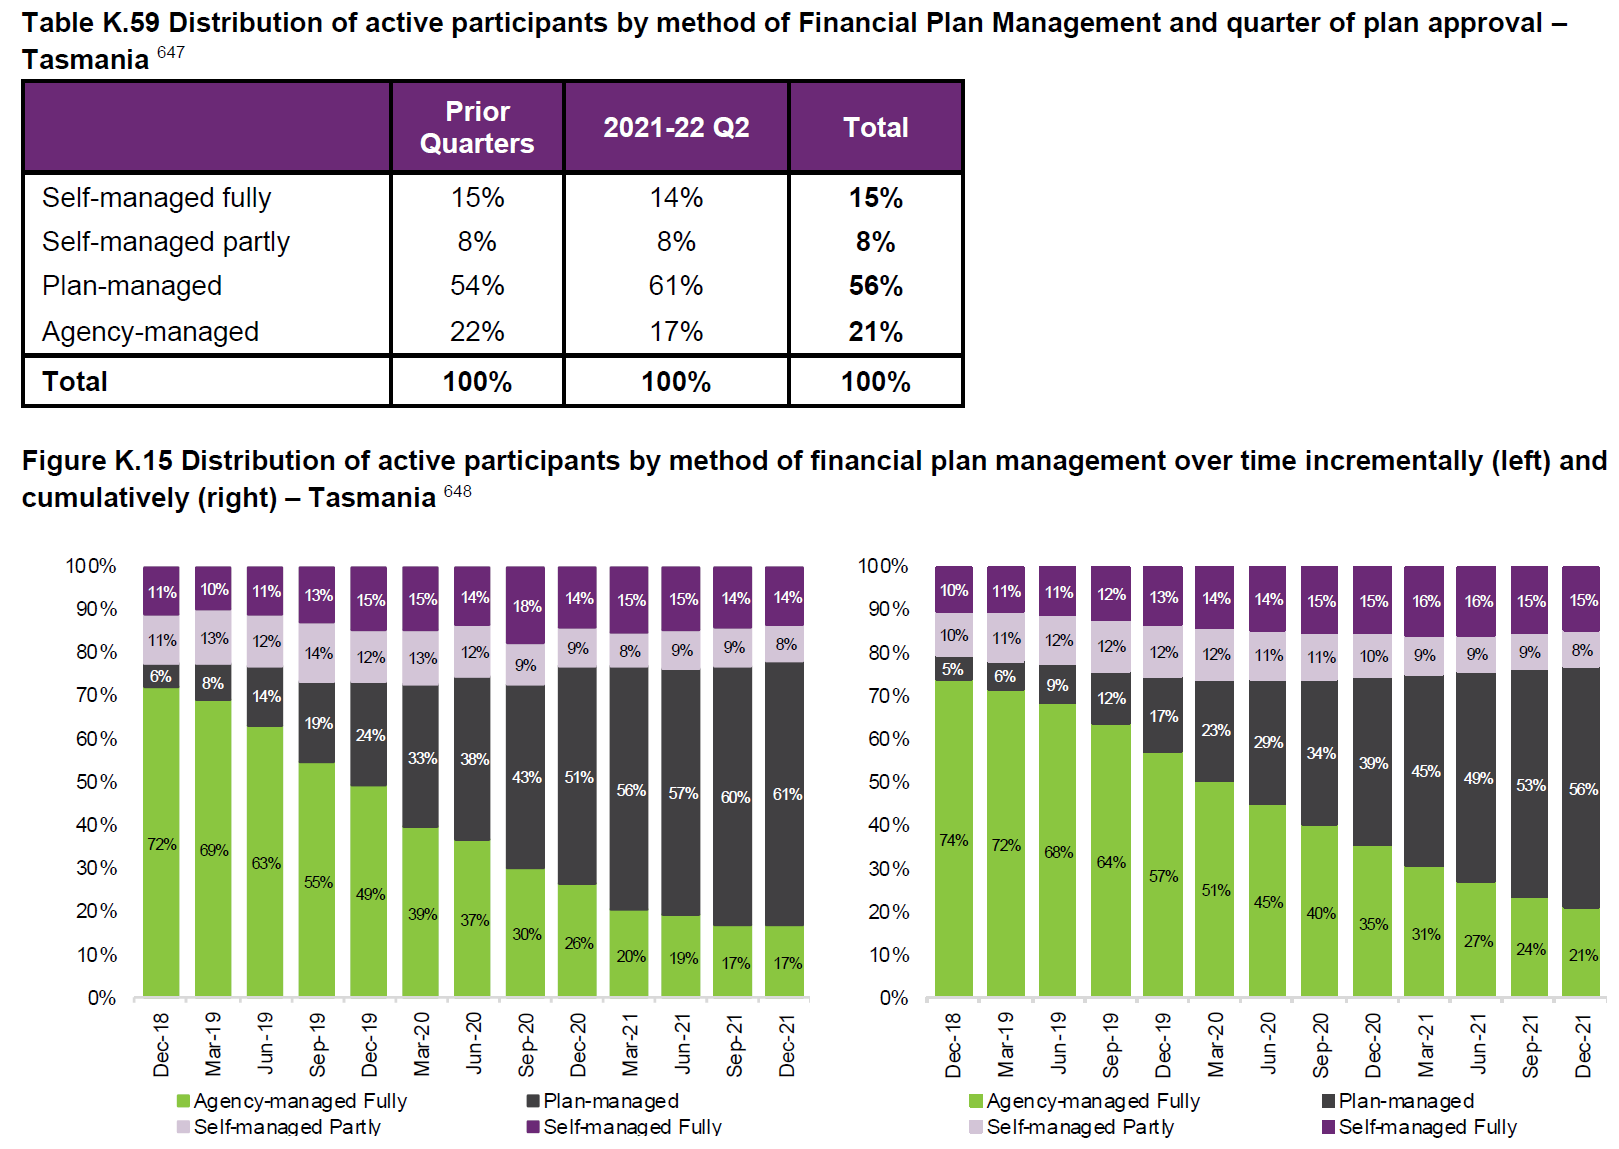
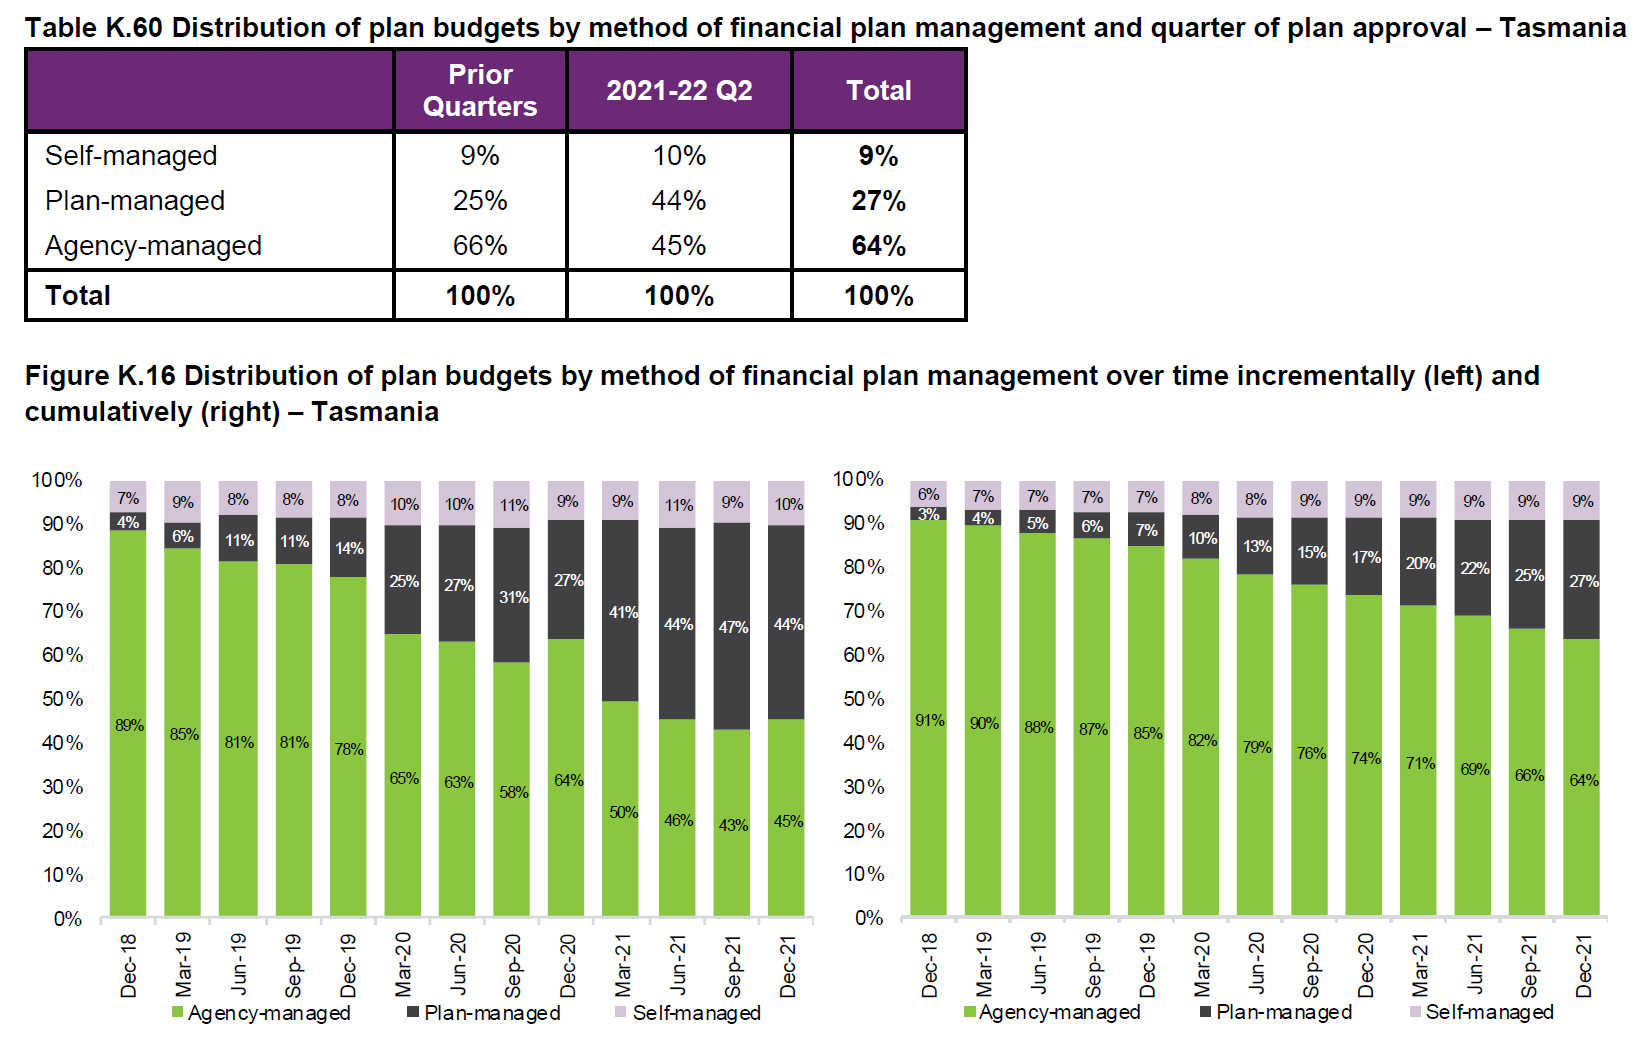
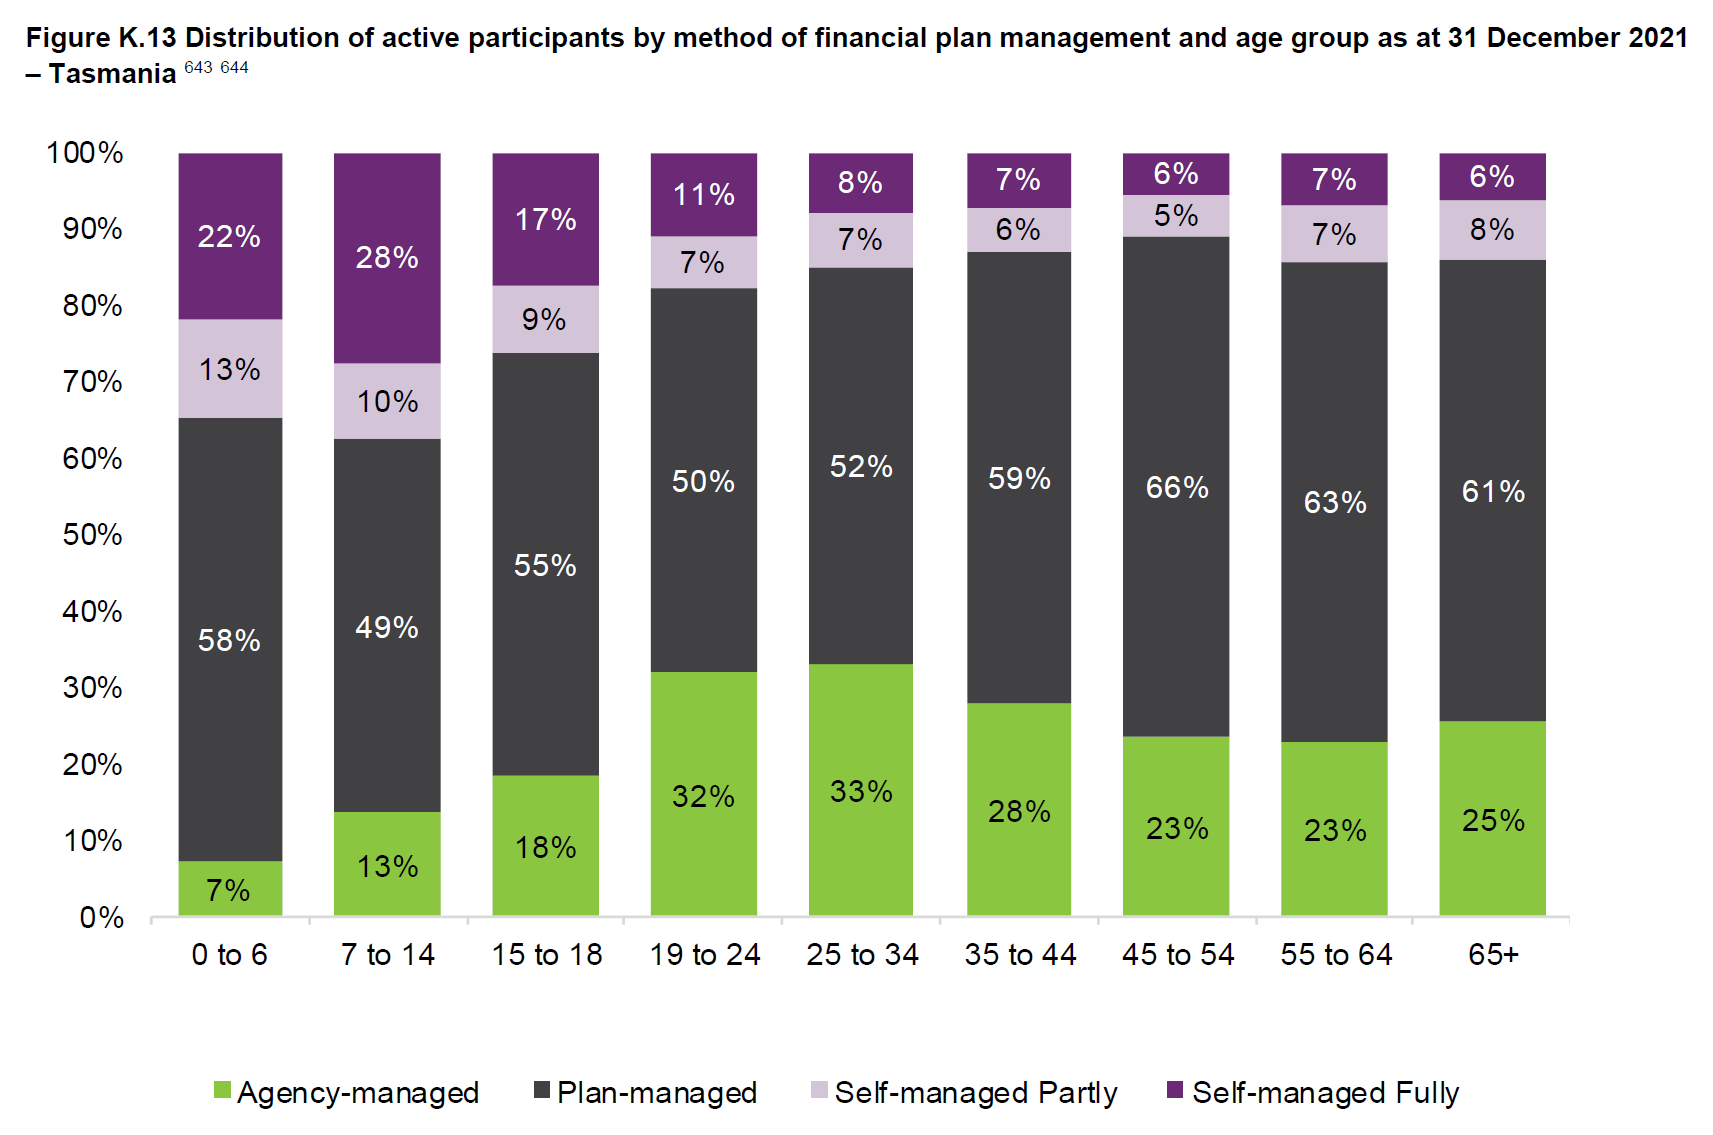
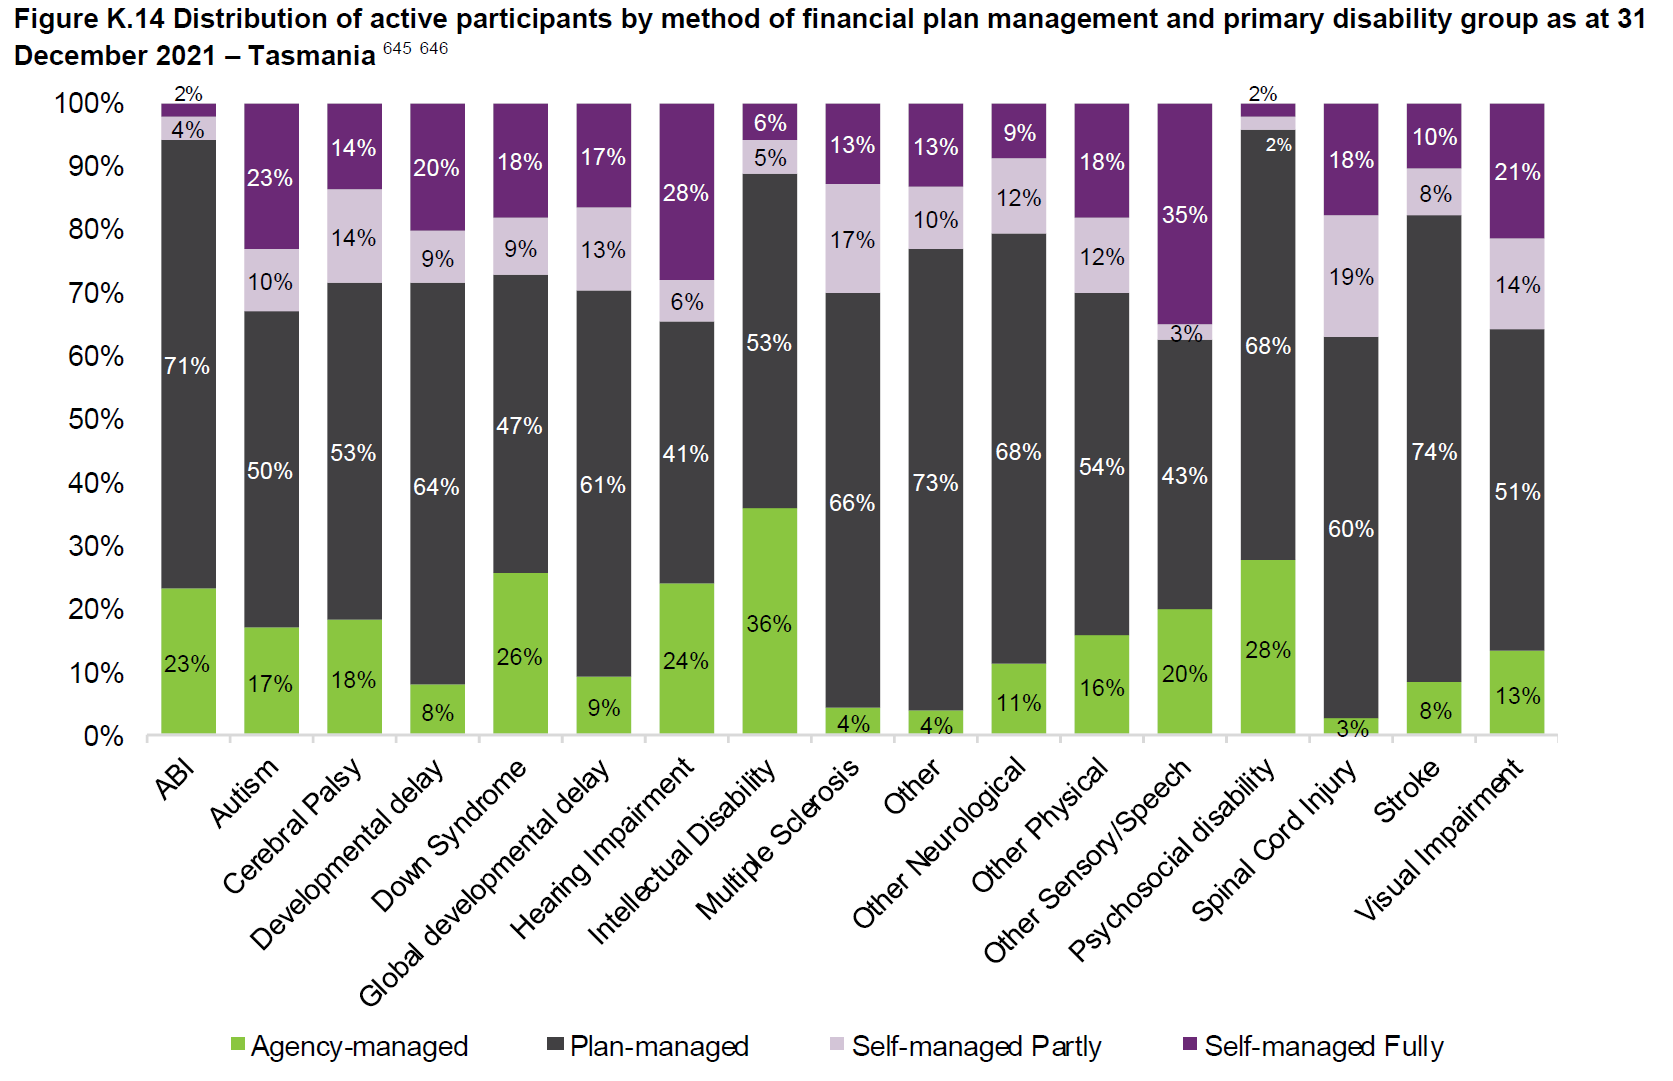
TASMANIA - PLAN MANAGEMENT
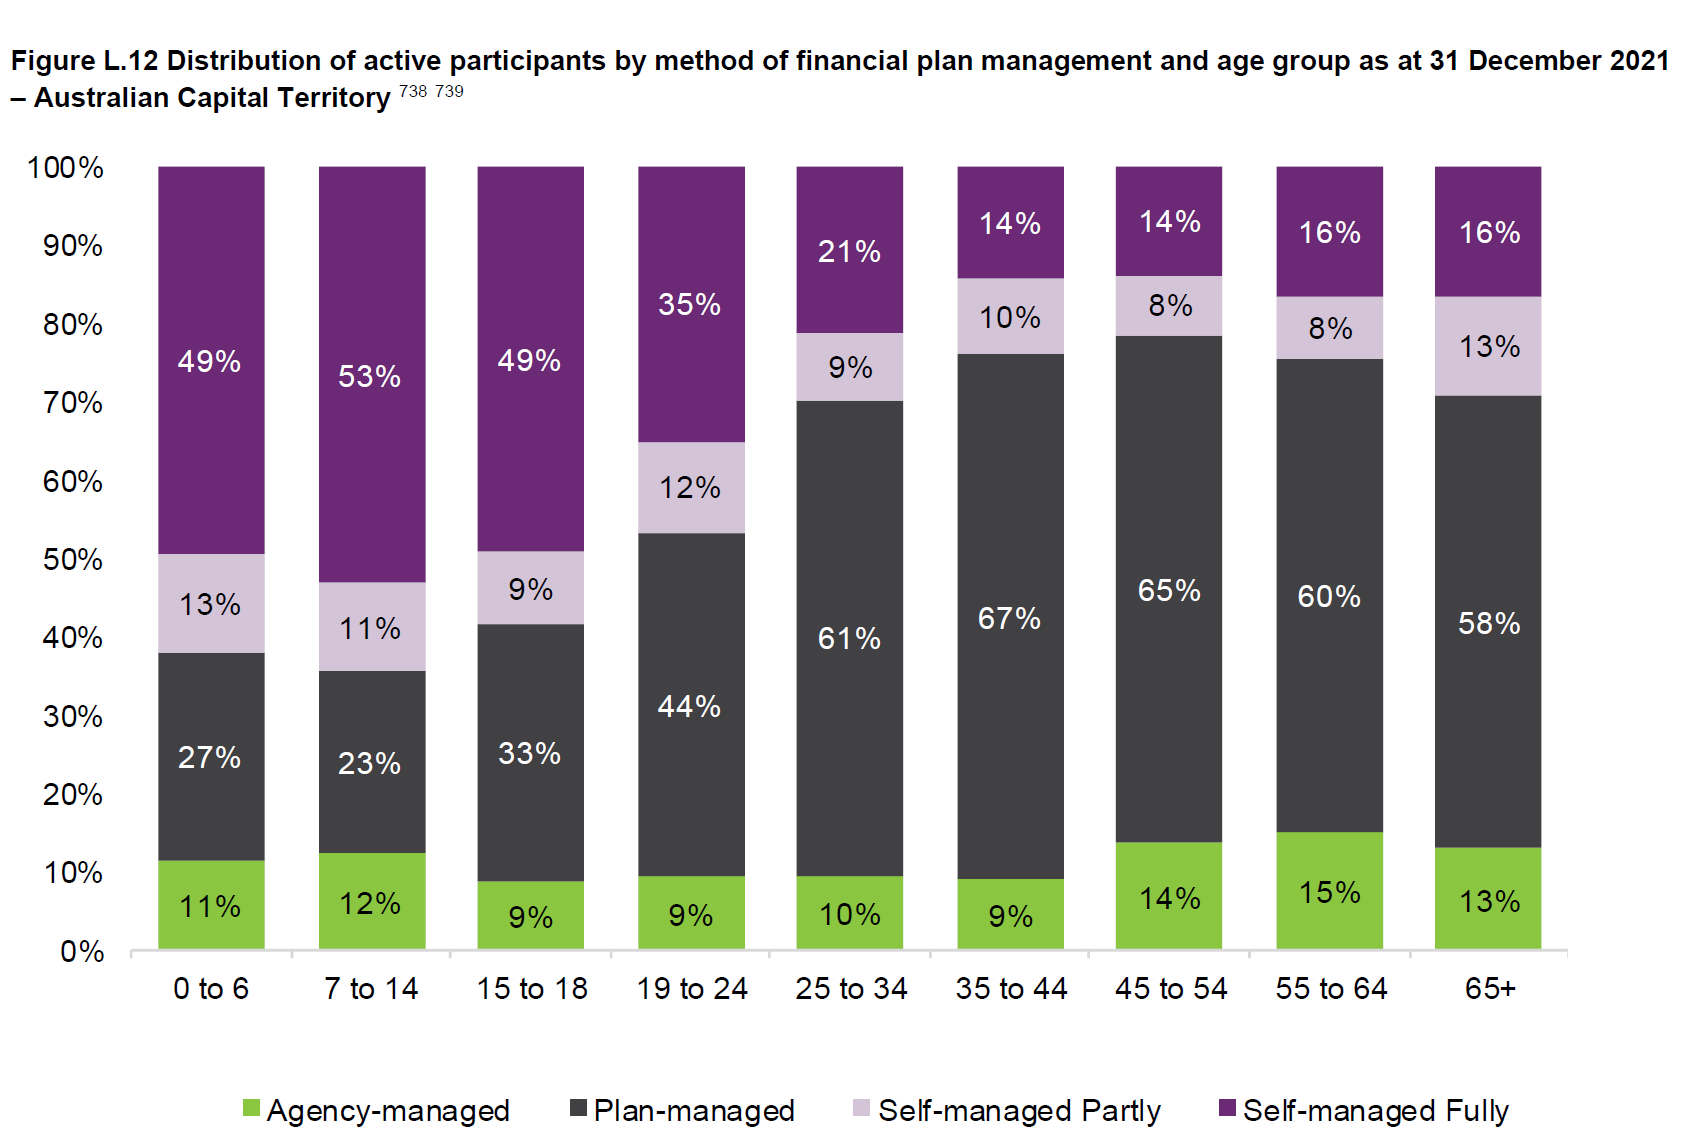
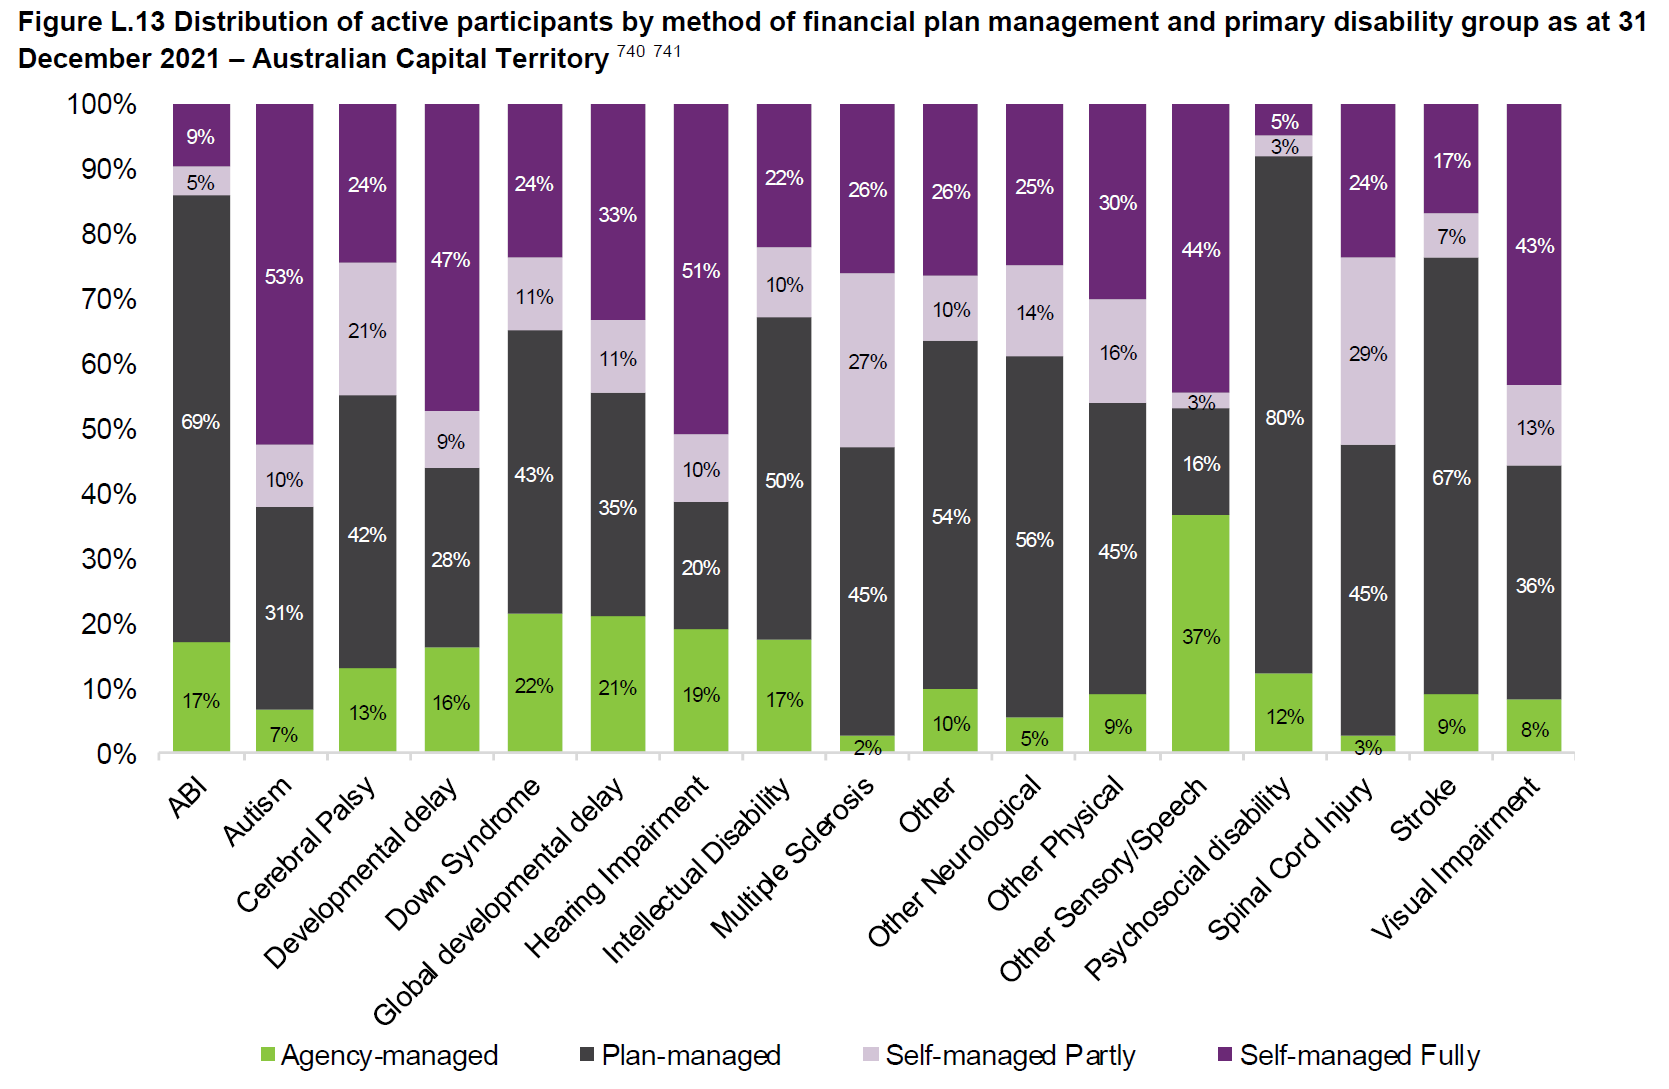
AUSTRALIAN CAPITAL TERRITORY - PLAN MANAGEMENT
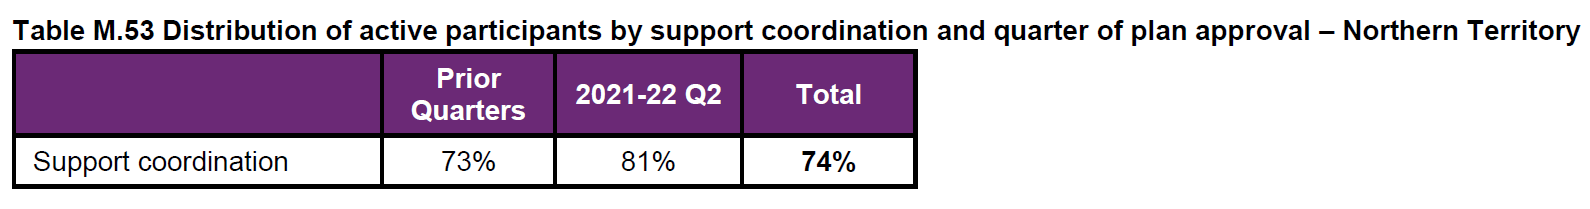
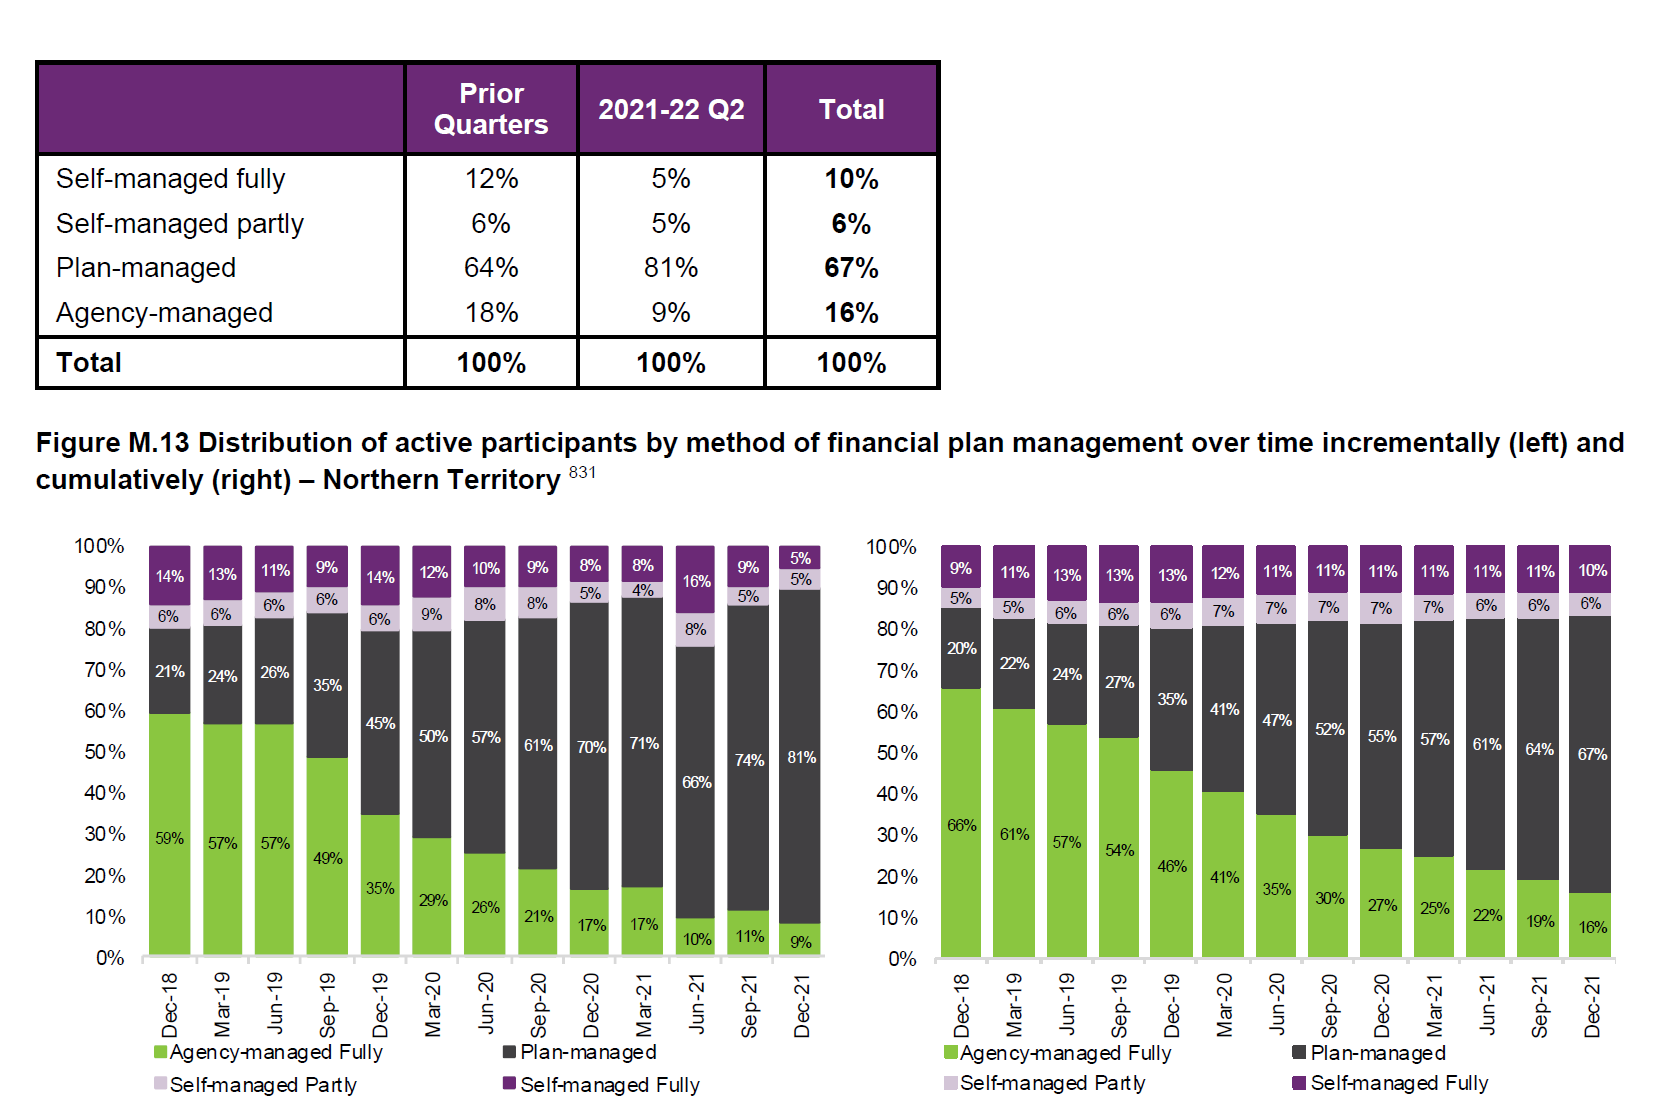
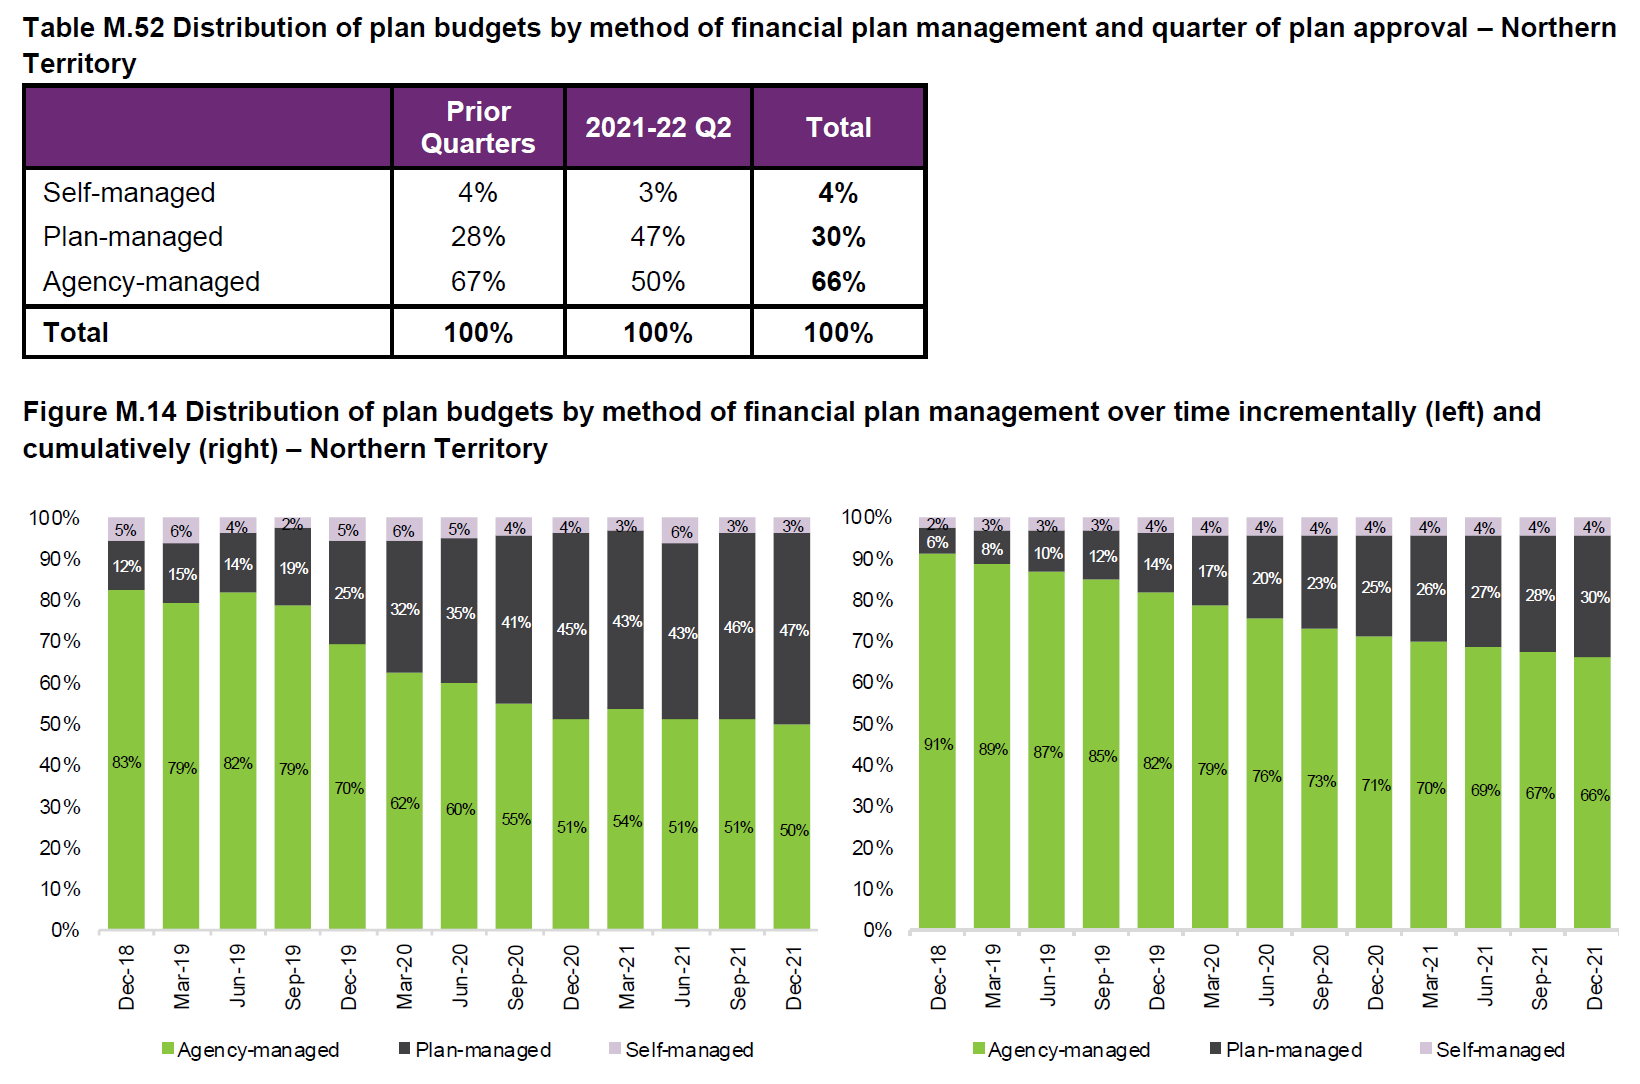
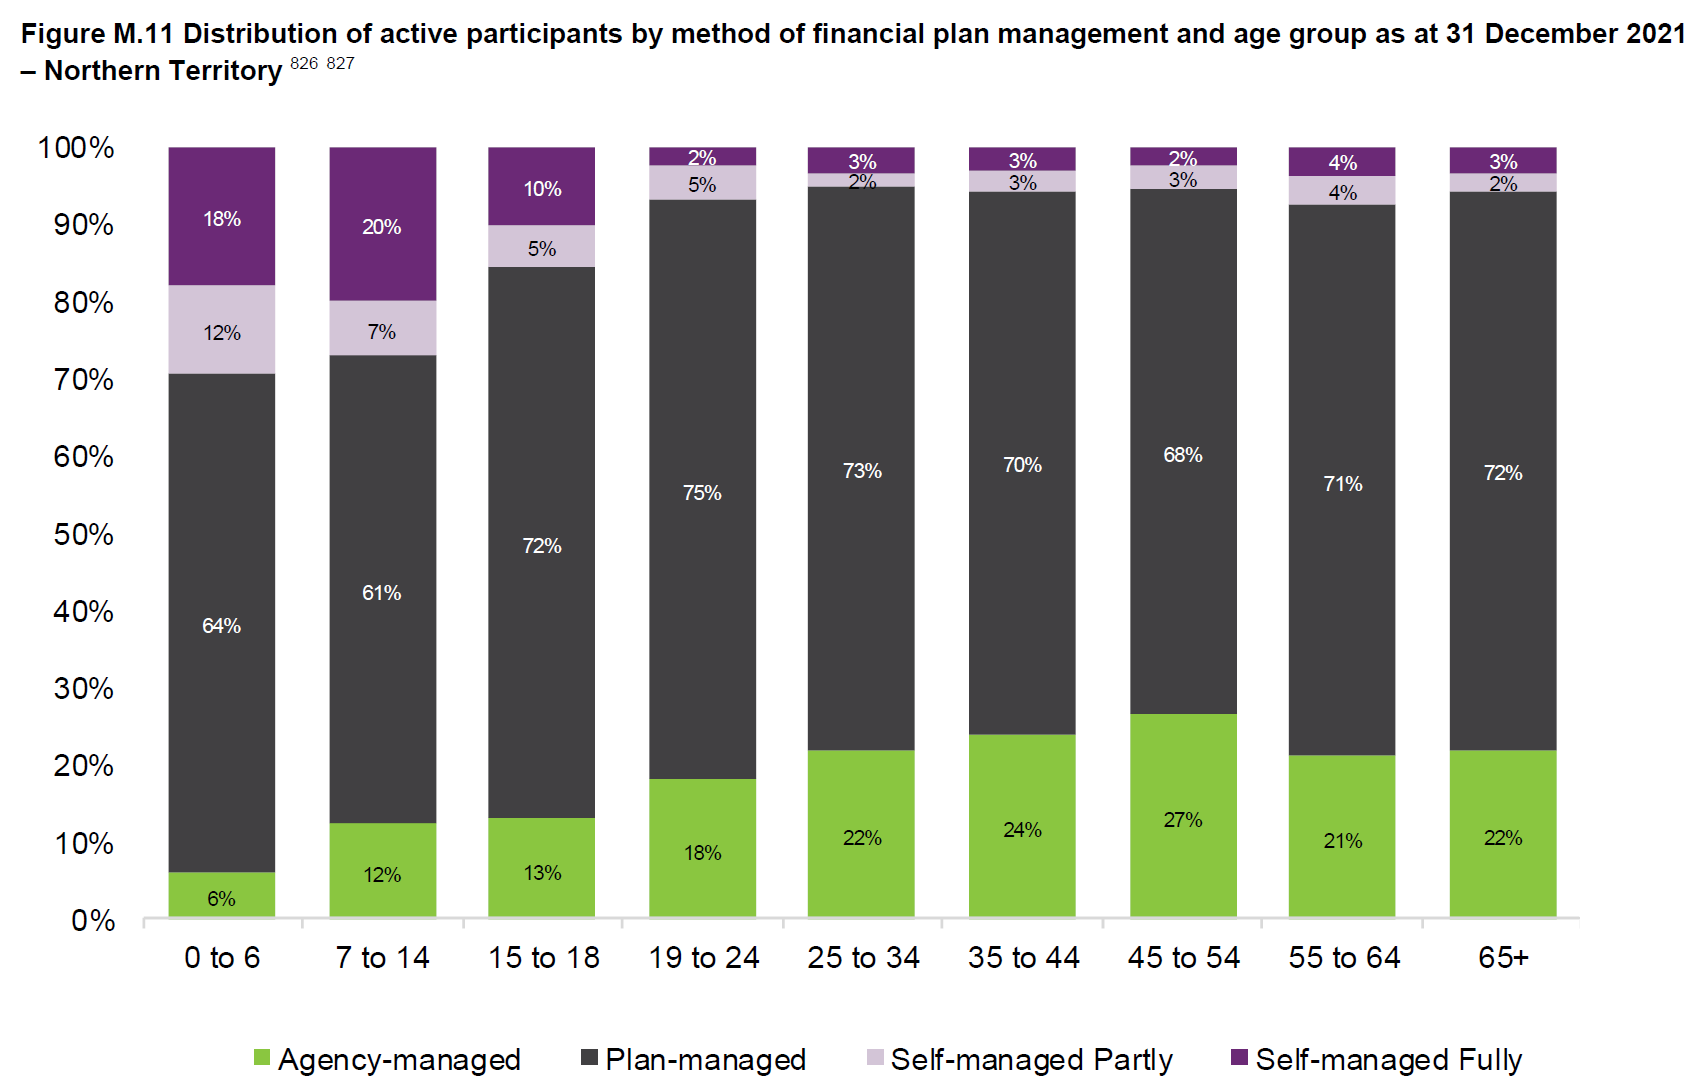
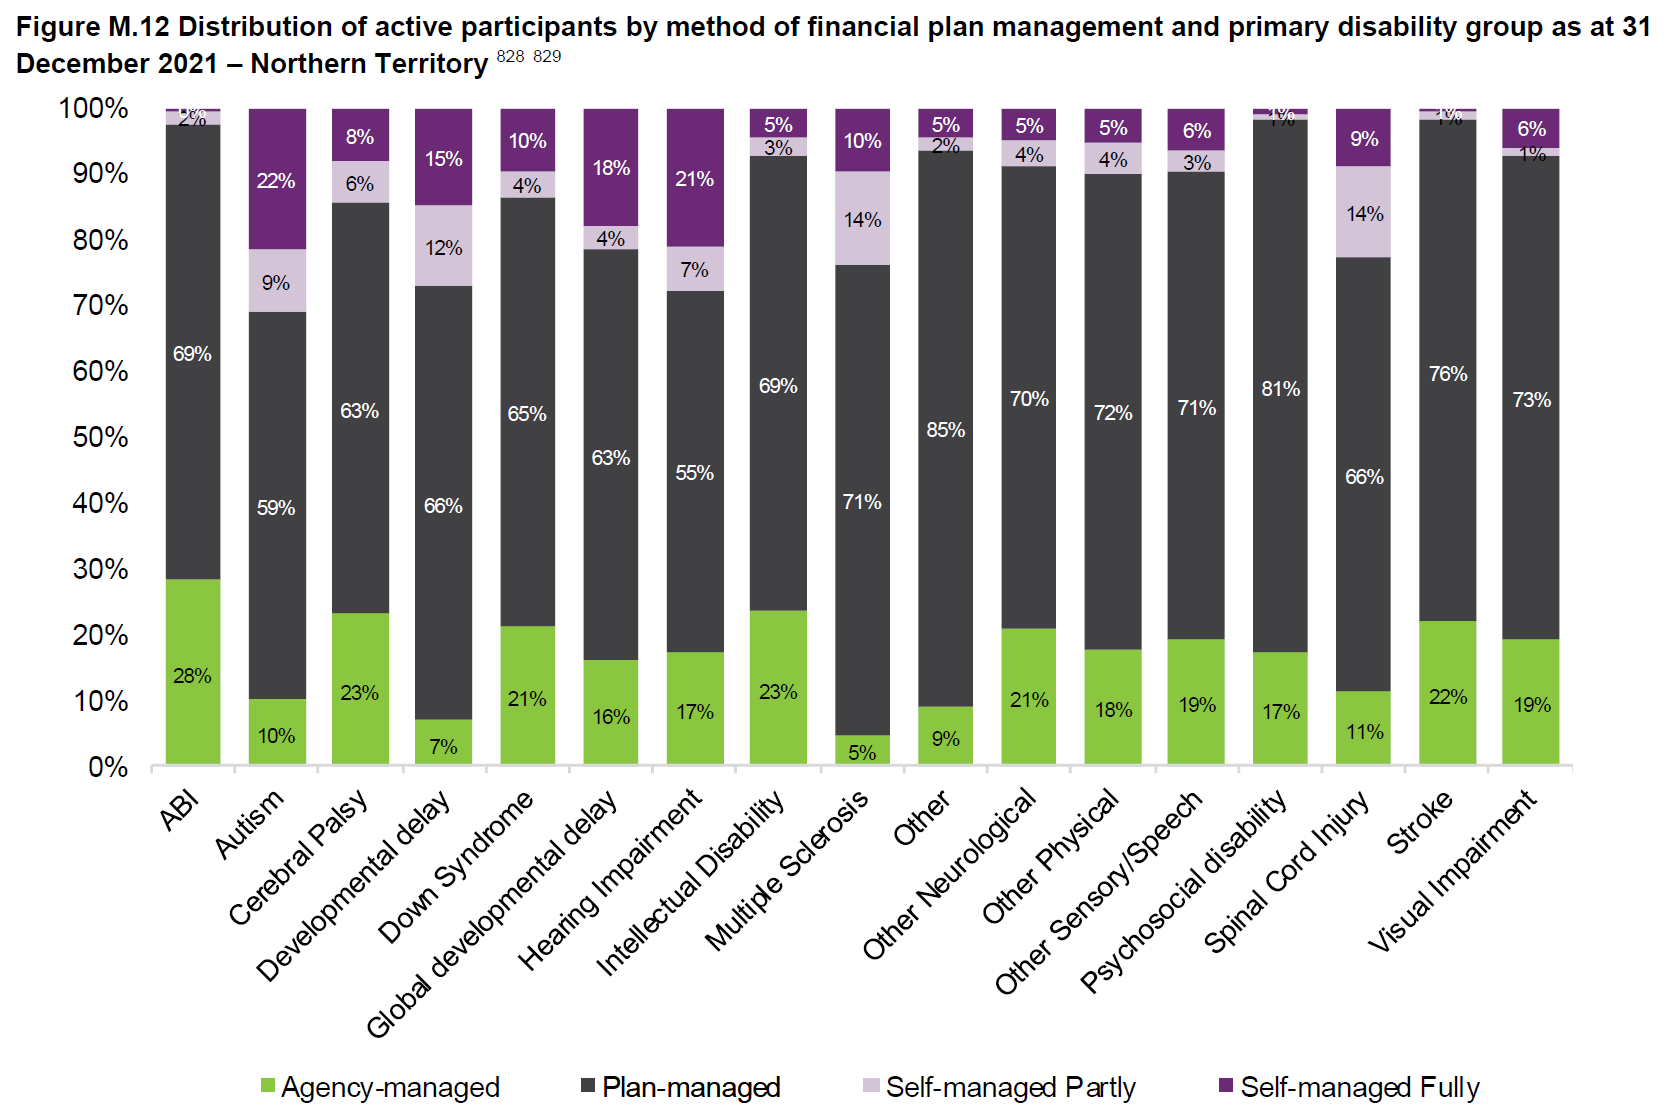
NORTHERN TERRITORY - PLAN MANAGEMENT
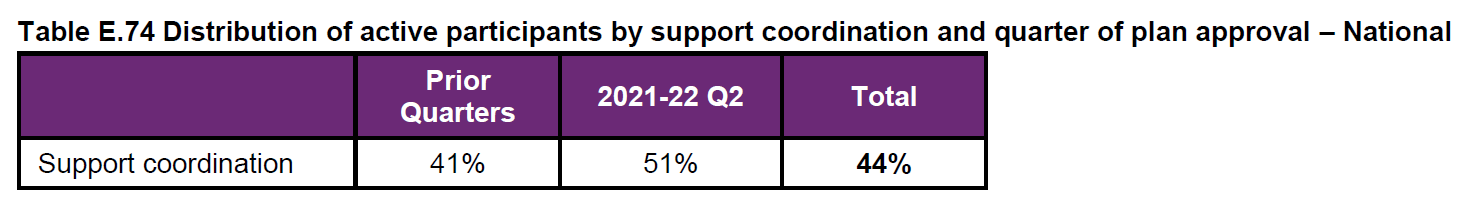
SUPPORT COORDINATION NATIONALLY
- 51% of plans last quarter included support coordination, an increase of 10% from previous quarters.
- Support coordination accounts for approximatly 3% of the total annualised committed support funding.
- As DIA noted when reviewing the Q1 Report, the NDIA finally released the outcomes of the 2020 Support Coordination discussion paper in November. As predicted by DIA, unfortunately, the content lack any great depth or indeed increased clarity. Read DIA’s summary of the release here: DIA Summary – NDIA Improving Support Coordination for Participants
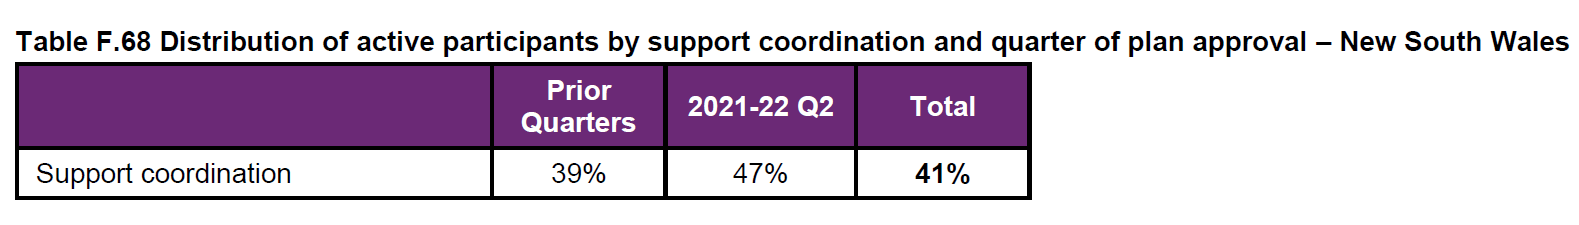
NEW SOUTH WALES - SUPPORT COORDINATION
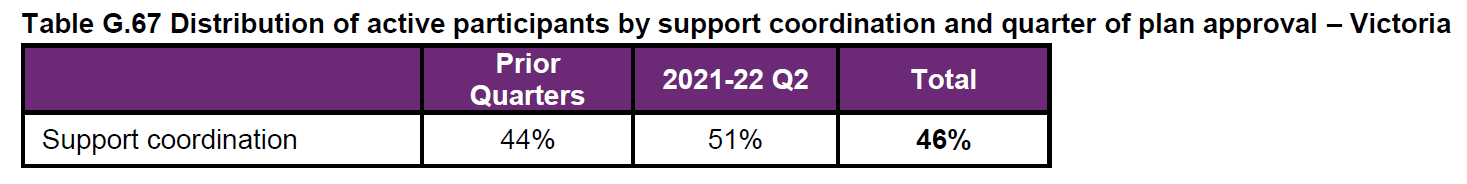
VICTORIA - SUPPORT COORDINATION
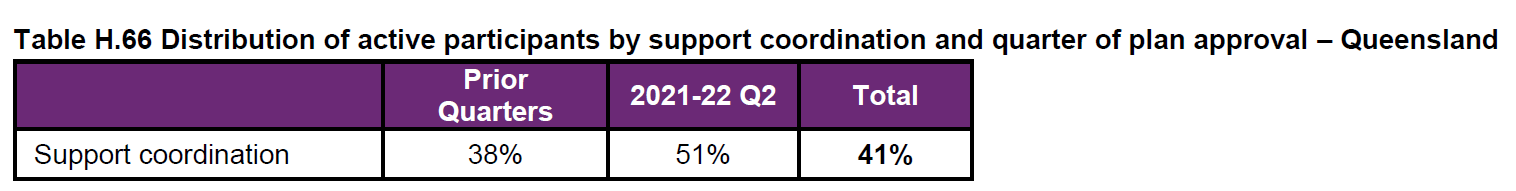
QUEENSLAND - SUPPORT COORDINATION
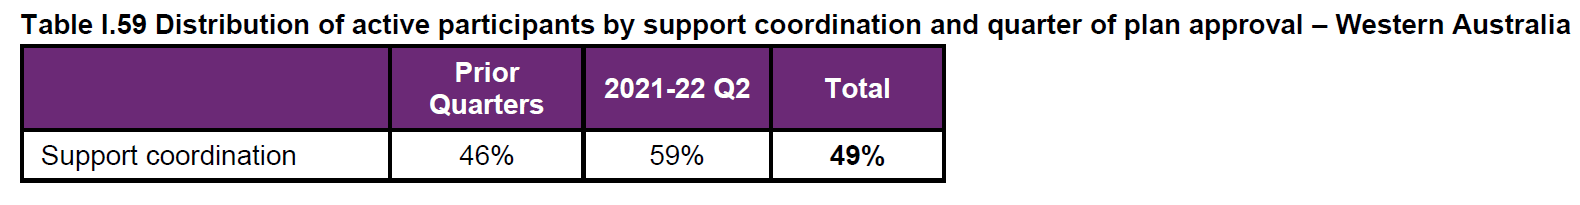
WESTERN AUSTRALIA - SUPPORT COORDINATION
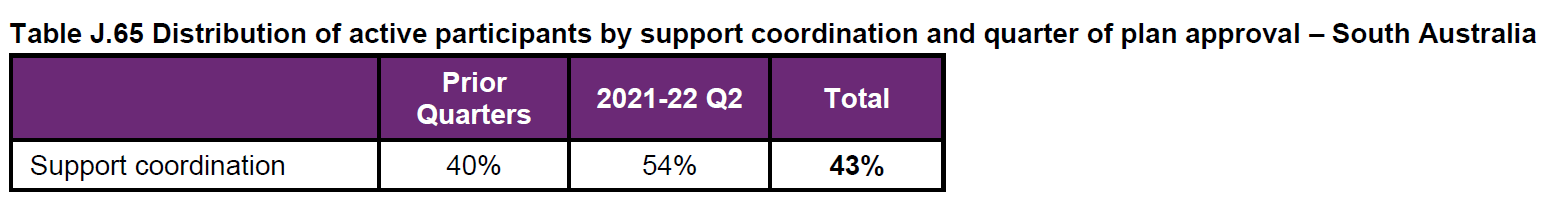
SOUTH AUSTRALIA - SUPPORT COORDINATION
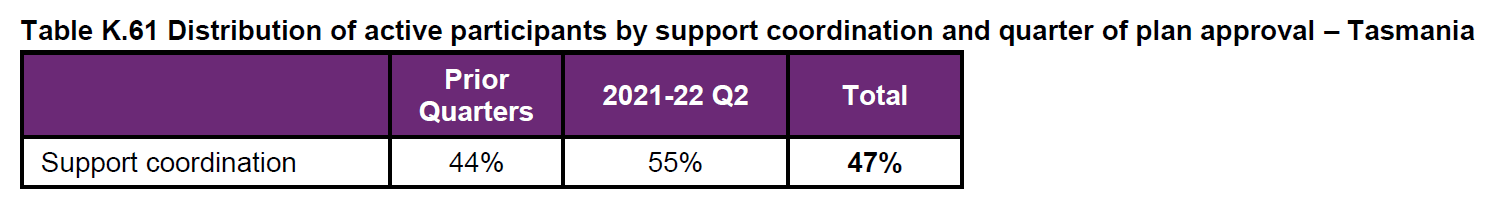
TASMANIA - SUPPORT COORDINATION
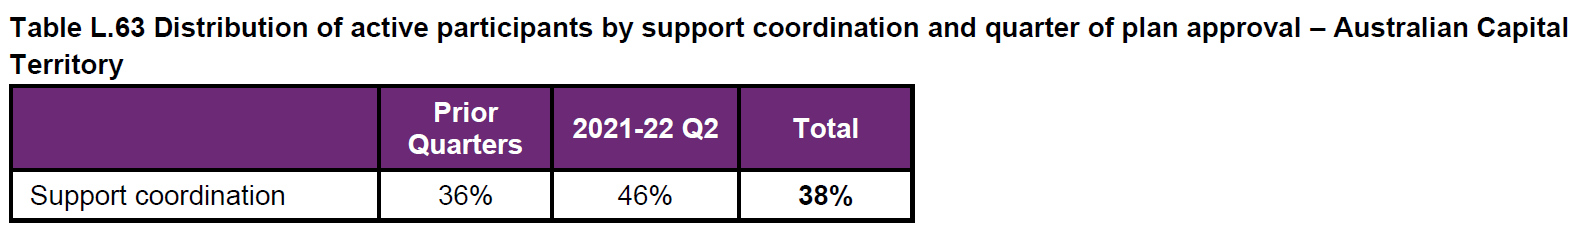
AUSTRALIAN CAPITAL TERRITORY - SUPPORT COORDINATION
NORTHERN TERRITORY - SUPPORT COORDINATION